[Home]
[Back to DMFold server]
[Back to Complex result page]
[Help]
DMFold results for example-model1-A
[Click result.zip to download all results on this page]
|
Input Sequence In FASTA Format
|
example-model1-A ( 171 residues )
|
>example-A
EIMPLTLKVNGKTEQLEVDTRTTLLDTLRENLHLIGTKKGCDHGQCGACTVLVNGRRLNACLTLAVMHQGAEITTIEGLGSPDNLHPMQAAFIKHDGFQCGYCTSGQICSSVAVLKEIQDGIPSHVTVDLVSAPETTADEIRERMSGNICRCGAYANILAAIEDAAGEIKS
|
|
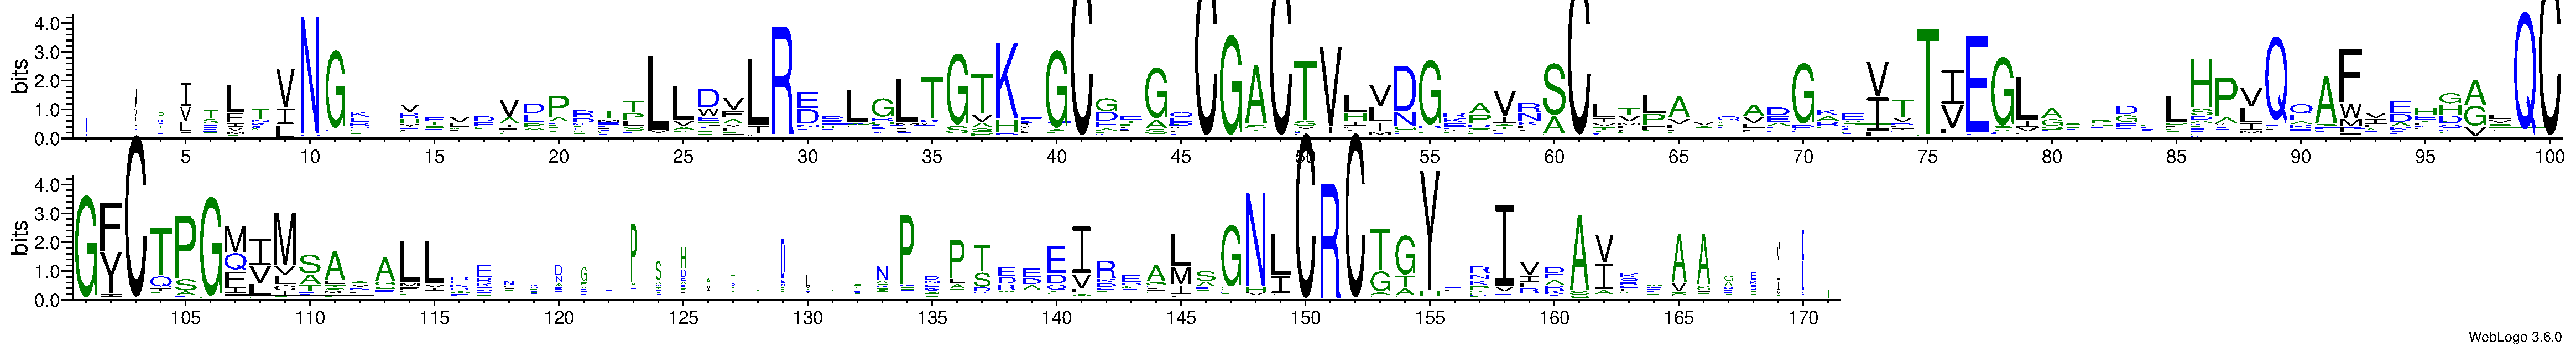
Multiple Sequence Alignments
|
|
Predicted Contact And Distance Map
|
Contact Map
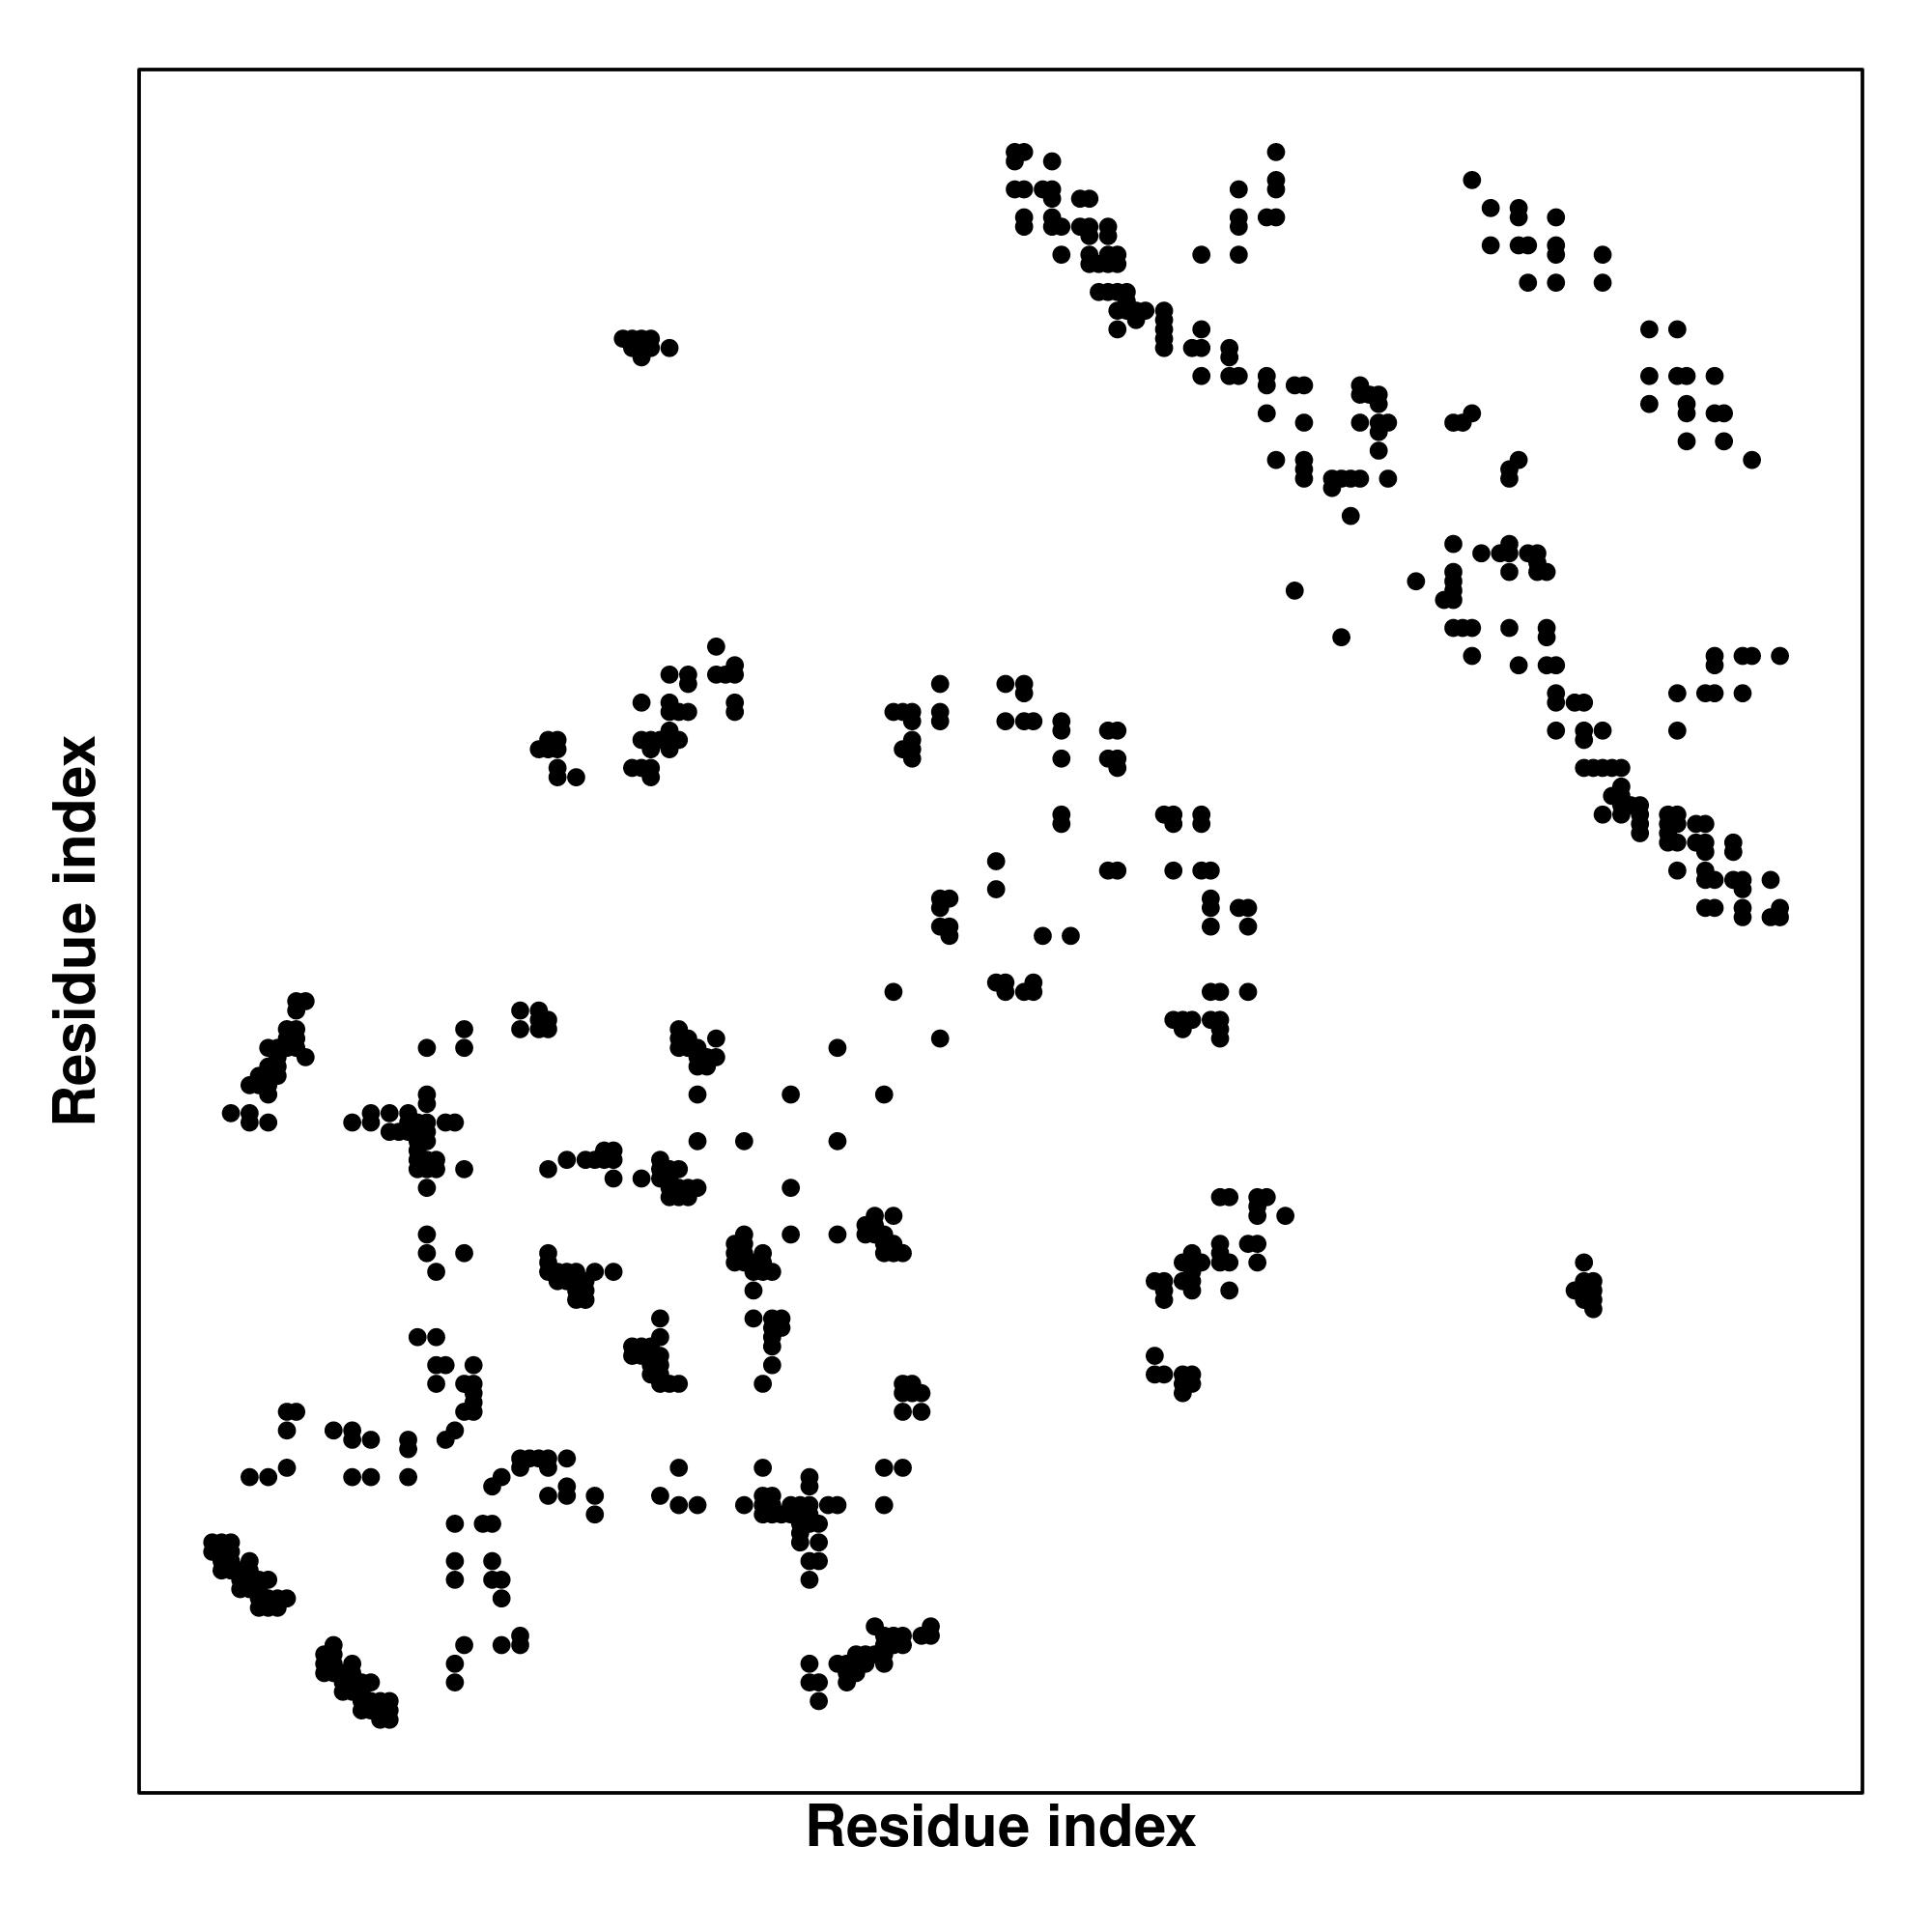
|
Distance Map
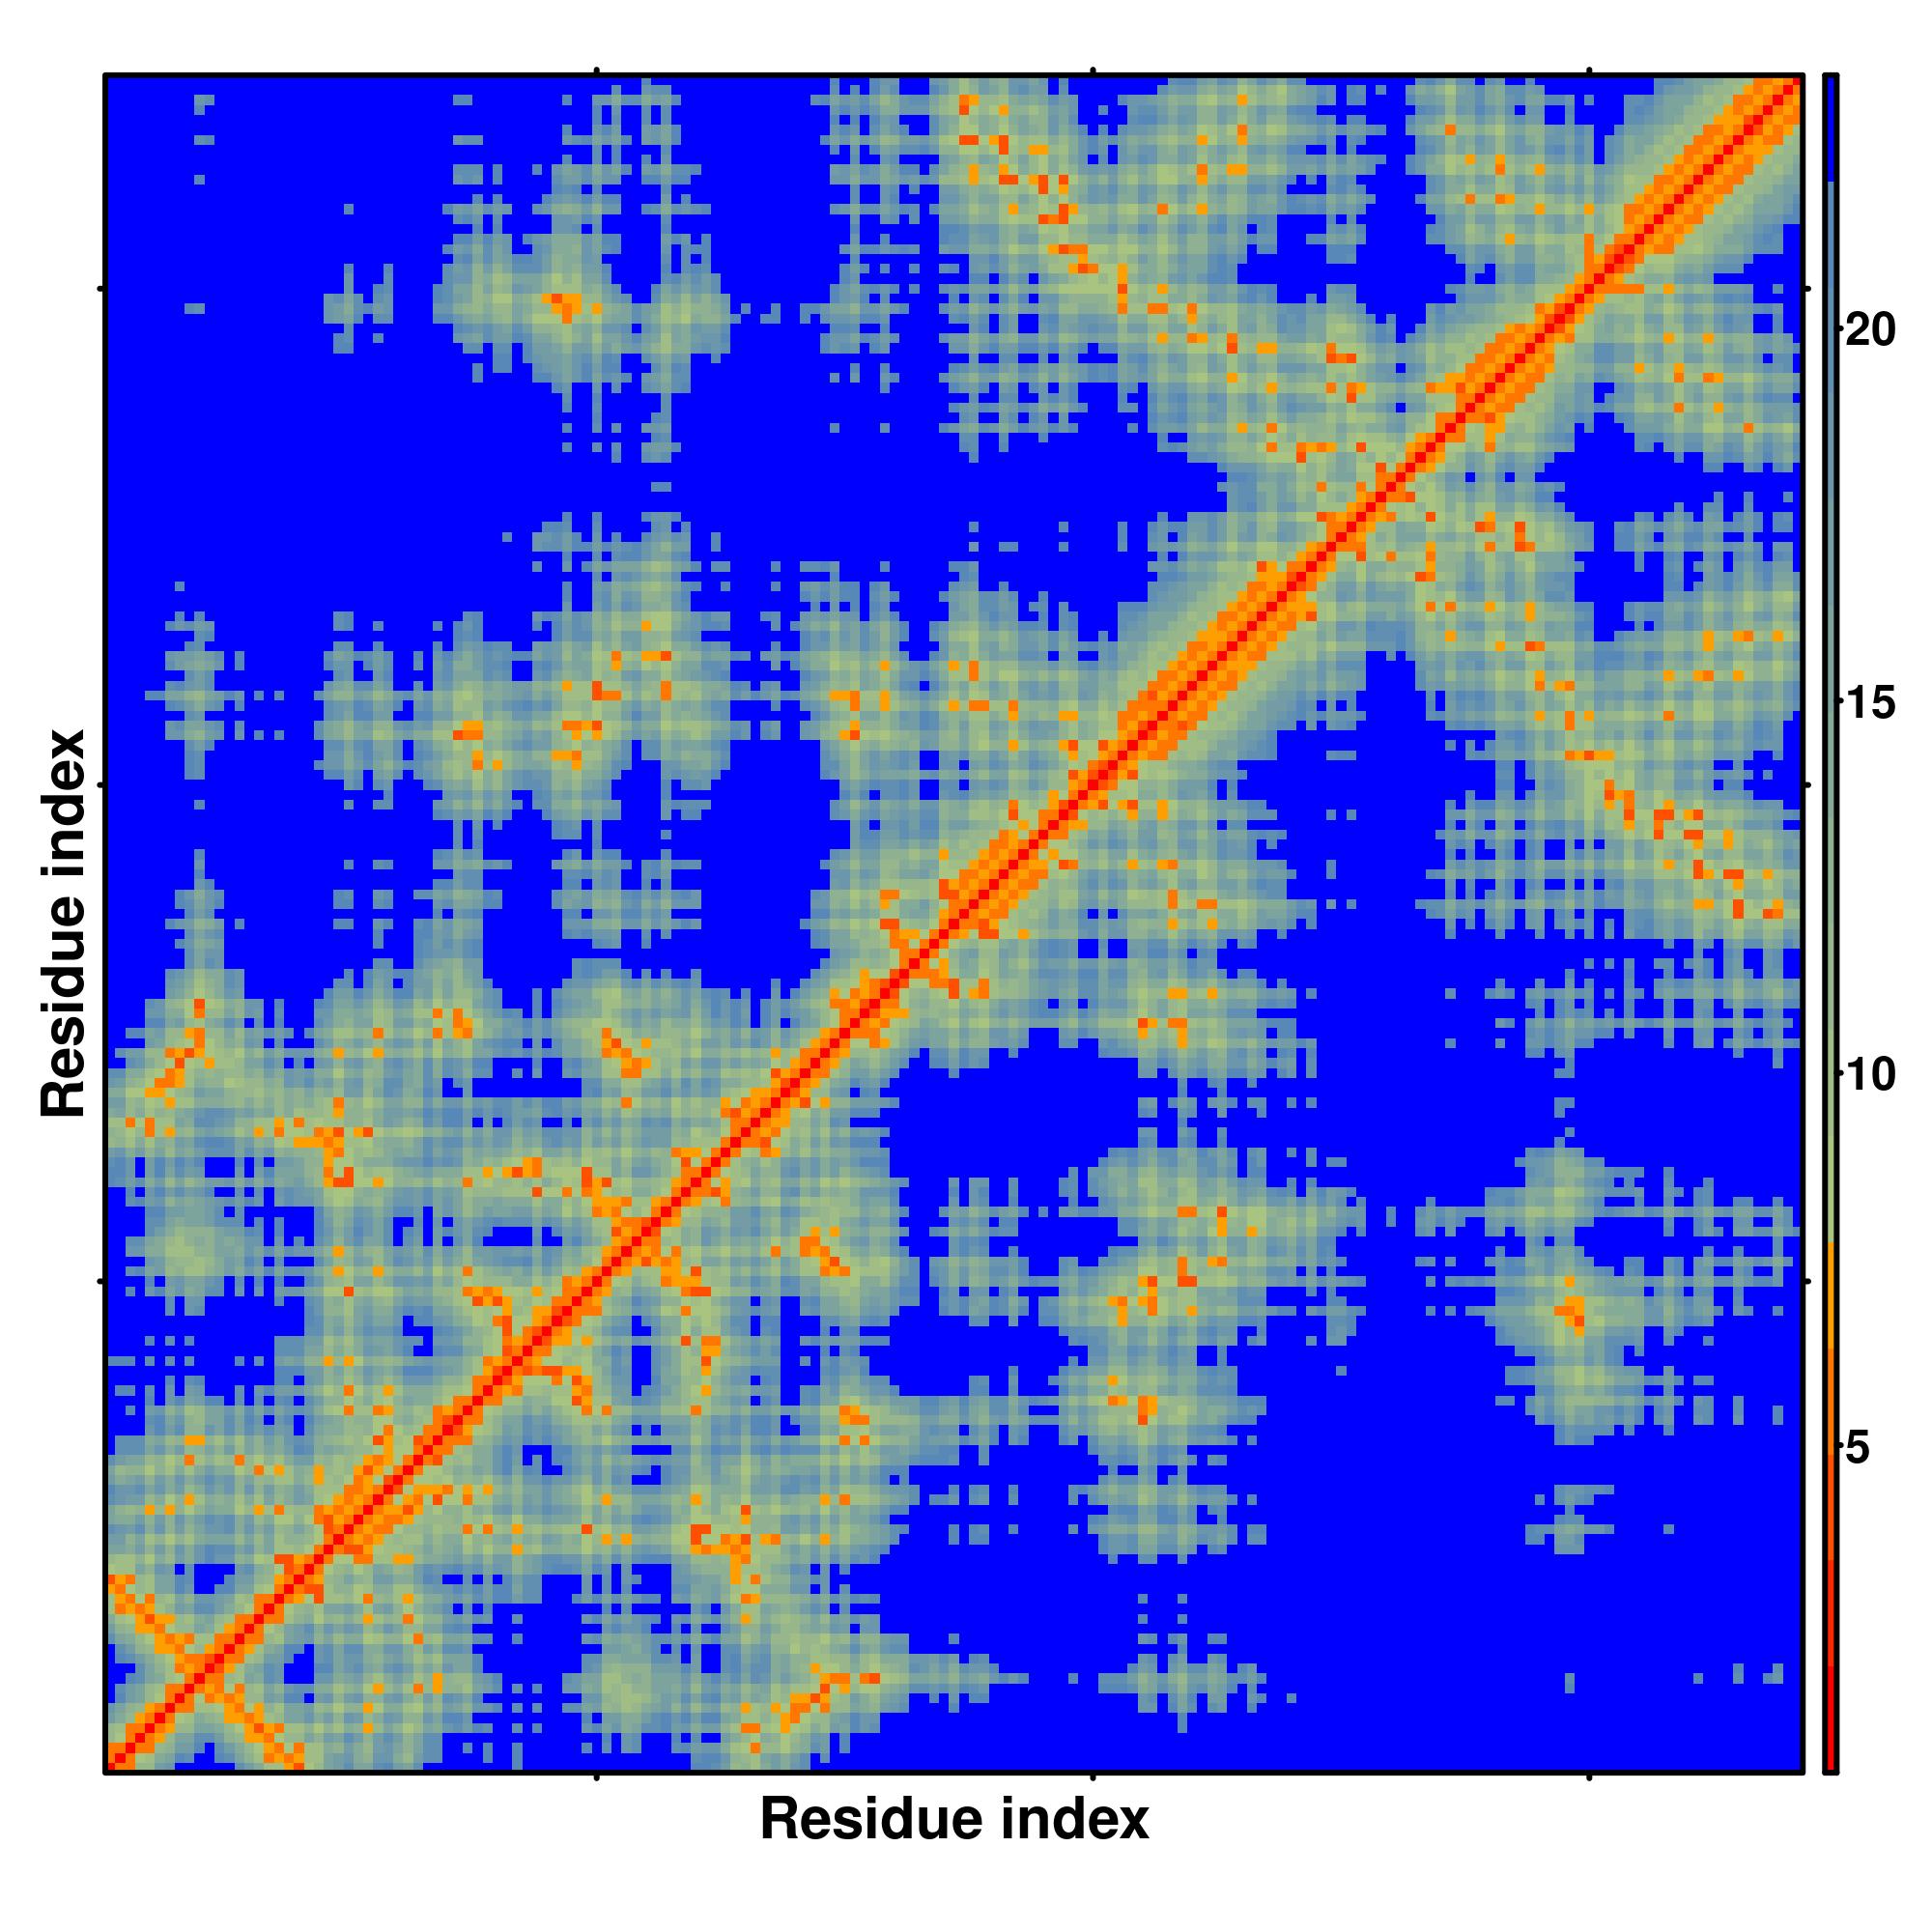
|
|
Top 1 Final Models From DMFold
|
|
|
Note: If the JSmol model is not visible, please refresh the page or click the radio buttons
|
|
| (a) | DMFold generates a large set of structural models by different MSAs as inputs. These models are ranked by predicted TM-score (pTM-score for multimer) or predicted LDDT (pLDDT for monomer) and top 1 models are selected with the highest predicted scores. |
|
|
Residue-level Modeling Quality
|
|
Proteins With Similar Structure
|
|
| |
Top 10 structural analogs in PDB (as identified by
TM-align)
Note: If the JSmol model is not visible, please refresh the page or click the radio buttons
| (a) | Query structure is shown in cartoon, while the structural analog is displayed using backbone trace. |
| (b) | Ranking of proteins is based on TM-score of the structural alignment between the query structure and known structures in the PDB library. |
| (c) | RMSDa is the RMSD between residues that are structurally aligned by TM-align. |
| (d) | IDENa is the percentage sequence identity in the structurally aligned region. |
| (e) | Cov. represents the coverage of the alignment by TM-align and is equal to the number of structurally aligned residues divided by length of the query protein. |
|
|
Predicted Gene Ontology (GO) Terms
|

|
| GO term | CscoreGO | Name |
| GO:0016491 | 1.00 | oxidoreductase activity |
| GO:1901363 | 0.93 | heterocyclic compound binding |
| GO:0097159 | 0.93 | organic cyclic compound binding |
| GO:0016903 | 0.93 | oxidoreductase activity, acting on the aldehyde or oxo group of donors |
| GO:0016726 | 0.93 | oxidoreductase activity, acting on CH or CH2 groups, NAD or NADP as acceptor |
| GO:0050660 | 0.92 | flavin adenine dinucleotide binding |
| GO:0004854 | 0.92 | xanthine dehydrogenase activity |
| Download full result of the above consensus prediction. |
| Click the graph to show a high resolution version. |
| (a) | CscoreGO is the confidence score of predicted GO terms. CscoreGO values range in between [0-1]; where a higher value indicates a better confidence in predicting the function using the template. |
| (b) | The graph shows the predicted terms within the Gene Ontology hierachy for Molecular Function. Confidently predicted terms are color coded by CscoreGO: |
| | [0.4,0.5) | [0.5,0.6) | [0.6,0.7) | [0.7,0.8) | [0.8,0.9) | [0.9,1.0] |
|
|

|
| GO term | CscoreGO | Name |
| GO:0044710 | 1.00 | single-organism metabolic process |
| GO:0044237 | 1.00 | cellular metabolic process |
| GO:0044763 | 0.99 | single-organism cellular process |
| GO:1901564 | 0.98 | organonitrogen compound metabolic process |
| GO:0044281 | 0.98 | small molecule metabolic process |
| GO:0006139 | 0.98 | nucleobase-containing compound metabolic process |
| GO:0072521 | 0.97 | purine-containing compound metabolic process |
| GO:0055086 | 0.97 | nucleobase-containing small molecule metabolic process |
| GO:1901565 | 0.96 | organonitrogen compound catabolic process |
| GO:1901361 | 0.96 | organic cyclic compound catabolic process |
| GO:0046700 | 0.96 | heterocycle catabolic process |
| GO:0044712 | 0.96 | single-organism catabolic process |
| GO:0044270 | 0.96 | cellular nitrogen compound catabolic process |
| GO:0019439 | 0.96 | aromatic compound catabolic process |
| GO:0009112 | 0.96 | nucleobase metabolic process |
| GO:0006145 | 0.95 | purine nucleobase catabolic process |
| GO:0009115 | 0.94 | xanthine catabolic process |
| GO:0055114 | 0.63 | oxidation-reduction process |
| Download full result of the above consensus prediction. |
| Click the graph to show a high resolution version. |
| (a) | CscoreGO is the confidence score of predicted GO terms. CscoreGO values range in between [0-1]; where a higher value indicates a better confidence in predicting the function using the template. |
| (b) | The graph shows the predicted terms within the Gene Ontology hierachy for Biological Process. Confidently predicted terms are color coded by CscoreGO: |
| | [0.4,0.5) | [0.5,0.6) | [0.6,0.7) | [0.7,0.8) | [0.8,0.9) | [0.9,1.0] |
|
|

|
| Download full result of the above consensus prediction. |
| Click the graph to show a high resolution version. |
| (a) | CscoreGO is the confidence score of predicted GO terms. CscoreGO values range in between [0-1]; where a higher value indicates a better confidence in predicting the function using the template. |
| (b) | The graph shows the predicted terms within the Gene Ontology hierachy for Cellular Component. Confidently predicted terms are color coded by CscoreGO: |
| | [0.4,0.5) | [0.5,0.6) | [0.6,0.7) | [0.7,0.8) | [0.8,0.9) | [0.9,1.0] |
|
|
|
|
Predicted Enzyme Commission (EC) Numbers
|
|
| |
Top 5 enzyme homologs in PDB
Note: If the JSmol model is not visible, please refresh the page or click the radio buttons
| | Click on the radio buttons to visualize predicted active site residues. |
| (a) | CscoreEC is the confidence score for the Enzyme Commission (EC) number prediction. CscoreEC values range in between [0-1]; where a higher score indicates a more reliable EC number prediction. |
| (b) | TM-score is a measure of global structural similarity between query and template protein. |
| (c) | RMSDa is the RMSD between residues that are structurally aligned by TM-align. |
| (d) | IDENa is the percentage sequence identity in the structurally aligned region. |
| (e) | Cov. represents the coverage of global structural alignment and is equal to the number of structurally aligned residues divided by length of the query protein. |
|
|
Predicted Ligand Binding Sites
|
|
Template proteins with similar binding site:
Click
to view | Rank | CscoreLB | PDB
Hit | TM-score | RMSDa | IDENa | Cov. | BS-score | Lig. Name | Download
Complex | Predicted binding site residues |
|
| 1 |
0.59 |
1ffuA |
0.861 |
1.51 |
0.419 |
0.906 |
1.71 |
FES |
Download |
999,100,101,103,150,151,152 |
|
| 2 |
0.54 |
1t3qA |
0.857 |
1.62 |
0.417 |
0.912 |
1.70 |
FES |
Download |
339,40,41,42,44,45,46,47,48,49,59,61 |
|
| 3 |
0.09 |
1t3qA |
0.857 |
1.62 |
0.417 |
0.912 |
1.72 |
FAD |
Download |
443,44,45,62 |
|
| 4 |
0.08 |
1ffv3 |
0.867 |
1.53 |
0.417 |
0.912 |
1.51 |
III |
Download |
119,20,21,23,39,41,42,50,56,57,59,61,62,63,64,66,67,110,143,144,146,147,148 |
|
| 5 |
0.08 |
1ffv1 |
0.867 |
1.53 |
0.417 |
0.912 |
1.50 |
III |
Download |
221,23,26,29,30,33,35,36,38,40,41,42,43,45,76,85,89,93,94,96,98,99,100,101,102,103,108,142,143,146,149,151,152,153,154,155,156,157 |
Note: If the JSmol model is not visible, please refresh the page or click the radio buttons
| | Click on the radio buttons to visualize predicted binding site and residues. |
| (a) | CscoreLB is the confidence score of predicted binding site. CscoreLB values range in between [0-1]; where a higher score indicates a more reliable ligand-binding site prediction. |
| (b) | BS-score is a measure of local similarity (sequence & structure) between template binding site and predicted binding site in the query structure. Based on large scale benchmarking analysis, we have observed that a BS-score >1 reflects a significant local match between the predicted and template binding site.
| | (c) | TM-score is a measure of global structural similarity between query and template protein. |
| (d) | RMSDa the RMSD between residues that are structurally aligned by TM-align. |
| (e) | IDENa is the percentage sequence identity in the structurally aligned region. |
| (f) | Cov. represents the coverage of global structural alignment and is equal to the number of structurally aligned residues divided by length of the query protein. |
|
[Back to server]
|
Reference:
Qiqige Wuyun, Quancheng Liu, Yiying Guo, Lydia Freddolino, Wei Zheng.
DMFold: A deep learning platform for protein complex structure and function predictions based on DeepMSA2.
In preparation.
Wei Zheng, Qiqige Wuyun, Yang Li, Chengxin Zhang, P Lydia Freddolino, Yang Zhang.
Improving deep learning protein monomer and complex structure prediction using DeepMSA2 with huge metagenomics data.
Nature Methods, January 2024. https://doi.org/10.1038/s41592-023-02130-4.
Wei Zheng, Qiqige Wuyun, Peter L Freddolino, Yang Zhang.
Integrating deep learning, threading alignments, and a multi-MSA strategy for high-quality protein monomer and complex structure prediction in CASP15.
1-20. Proteins. (2023). doi:10.1002/prot.26585.
|
|