|
Template proteins with similar binding site:
Click
to view | Rank | CscoreLB | PDB
Hit | TM-score | RMSDa | IDENa | Cov. | BS-score | Lig. Name | Download
Complex | Predicted binding site residues |
|---|
| 1 | 0.01 | 1gq2K | 0.533 | 4.36 | 0.071 | 0.948 | 0.38 | NA | complex1.pdb.gz | 73,74,75,77 |
| 2 | 0.01 | 1gz4B | 0.513 | 4.58 | 0.063 | 0.957 | 0.14 | ATP | complex2.pdb.gz | 47,48,95 |
| 3 | 0.01 | 1gq2G | 0.534 | 4.44 | 0.071 | 0.957 | 0.35 | NA | complex3.pdb.gz | 74,75,76,77 |
| 4 | 0.01 | 1pj2A | 0.530 | 4.45 | 0.045 | 0.930 | 0.13 | MLT | complex4.pdb.gz | 11,12,89 |
| 5 | 0.01 | 1gz3A | 0.530 | 4.36 | 0.036 | 0.930 | 0.16 | ATP | complex5.pdb.gz | 74,75,77,80,88 |
| 6 | 0.01 | 1do8B | 0.525 | 4.51 | 0.089 | 0.948 | 0.12 | NAD | complex6.pdb.gz | 14,65,66 |
| 7 | 0.01 | 1do8A | 0.523 | 4.42 | 0.089 | 0.939 | 0.16 | OXL | complex7.pdb.gz | 11,60,92 |
| 8 | 0.01 | 1pjlA | 0.493 | 4.35 | 0.046 | 0.835 | 0.13 | NAD | complex8.pdb.gz | 64,65,91 |
| 9 | 0.01 | 1llqA | 0.507 | 4.76 | 0.054 | 0.939 | 0.11 | NAD | complex9.pdb.gz | 65,66,67,76,80,82 |
| 10 | 0.01 | 1pjlF | 0.502 | 4.51 | 0.071 | 0.913 | 0.16 | NAD | complex10.pdb.gz | 76,77,80 |
| | Click on the radio buttons to visualize predicted binding site and residues. |
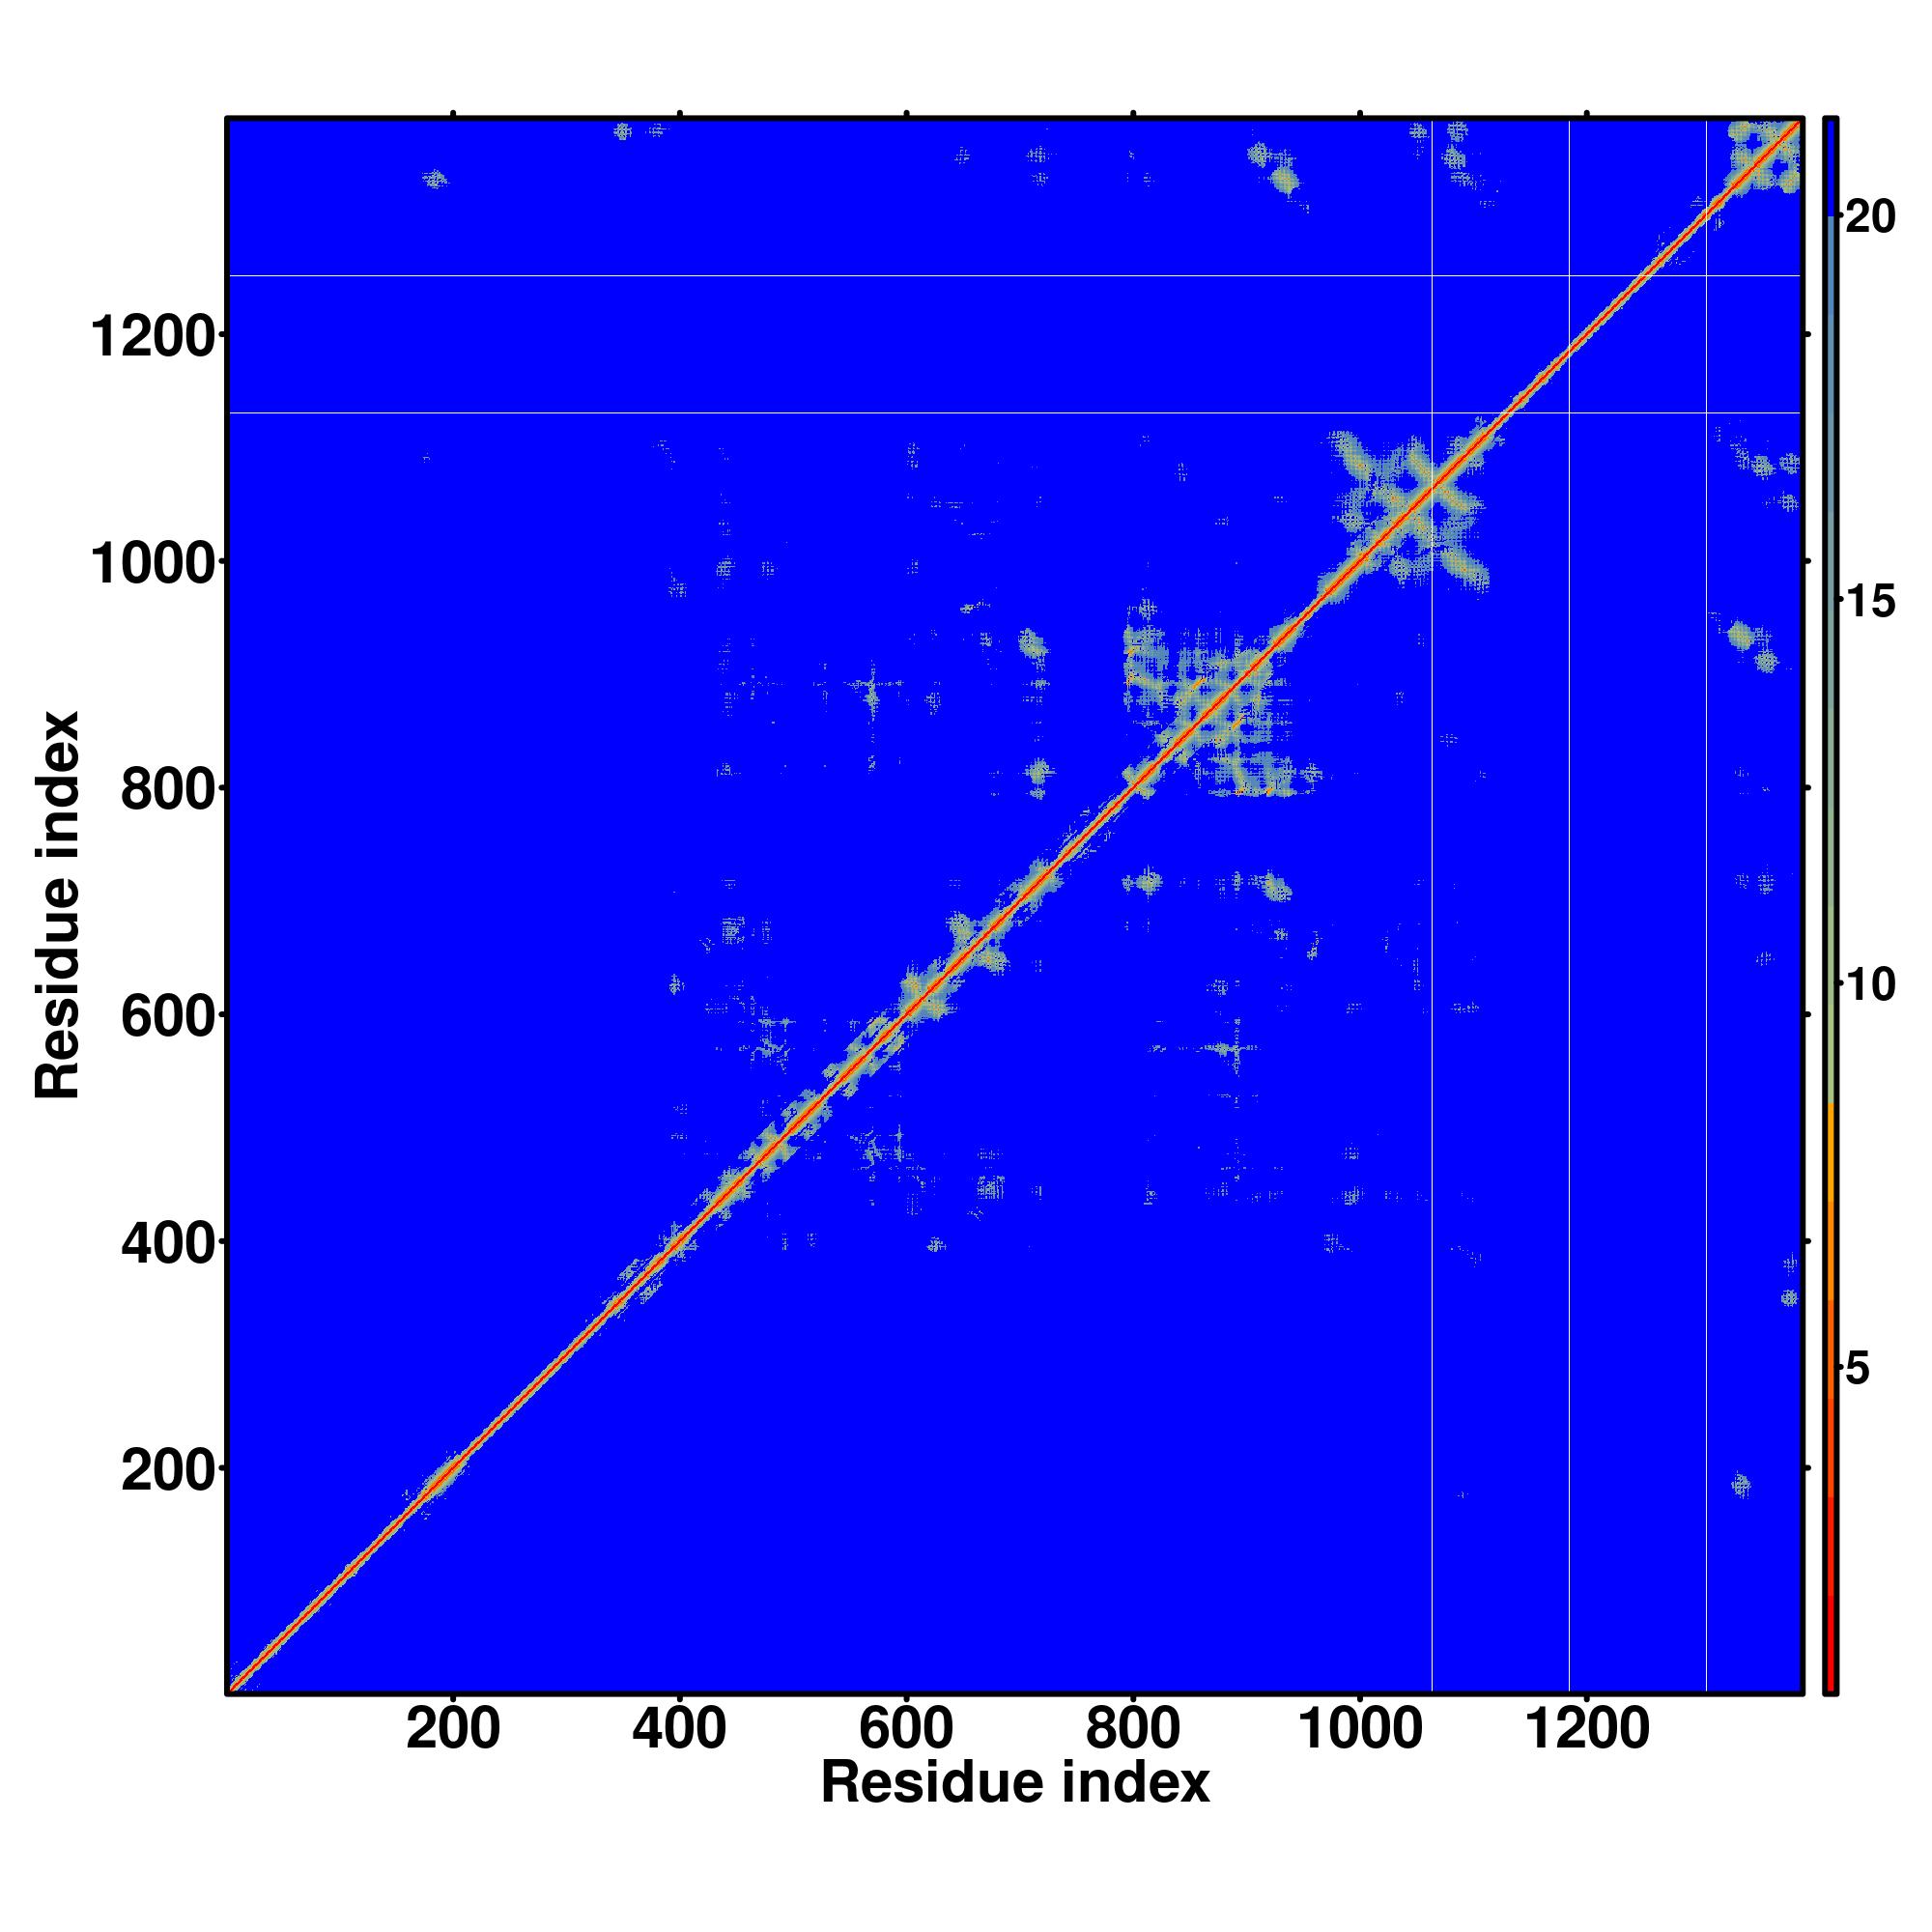
| (a) | CscoreLB is the confidence score of predicted binding site. CscoreLB values range in between [0-1]; where a higher score indicates a more reliable ligand-binding site prediction. |
| (b) | BS-score is a measure of local similarity (sequence & structure) between template binding site and predicted binding site in the query structure. Based on large scale benchmarking analysis, we have observed that a BS-score >1 reflects a significant local match between the predicted and template binding site.
| | (c) | TM-score is a measure of global structural similarity between query and template protein. |
| (d) | RMSDa the RMSD between residues that are structurally aligned by TM-align. |
| (e) | IDENa is the percentage sequence identity in the structurally aligned region. |
| (f) | Cov. represents the coverage of global structural alignment and is equal to the number of structurally aligned residues divided by length of the query protein. |
|