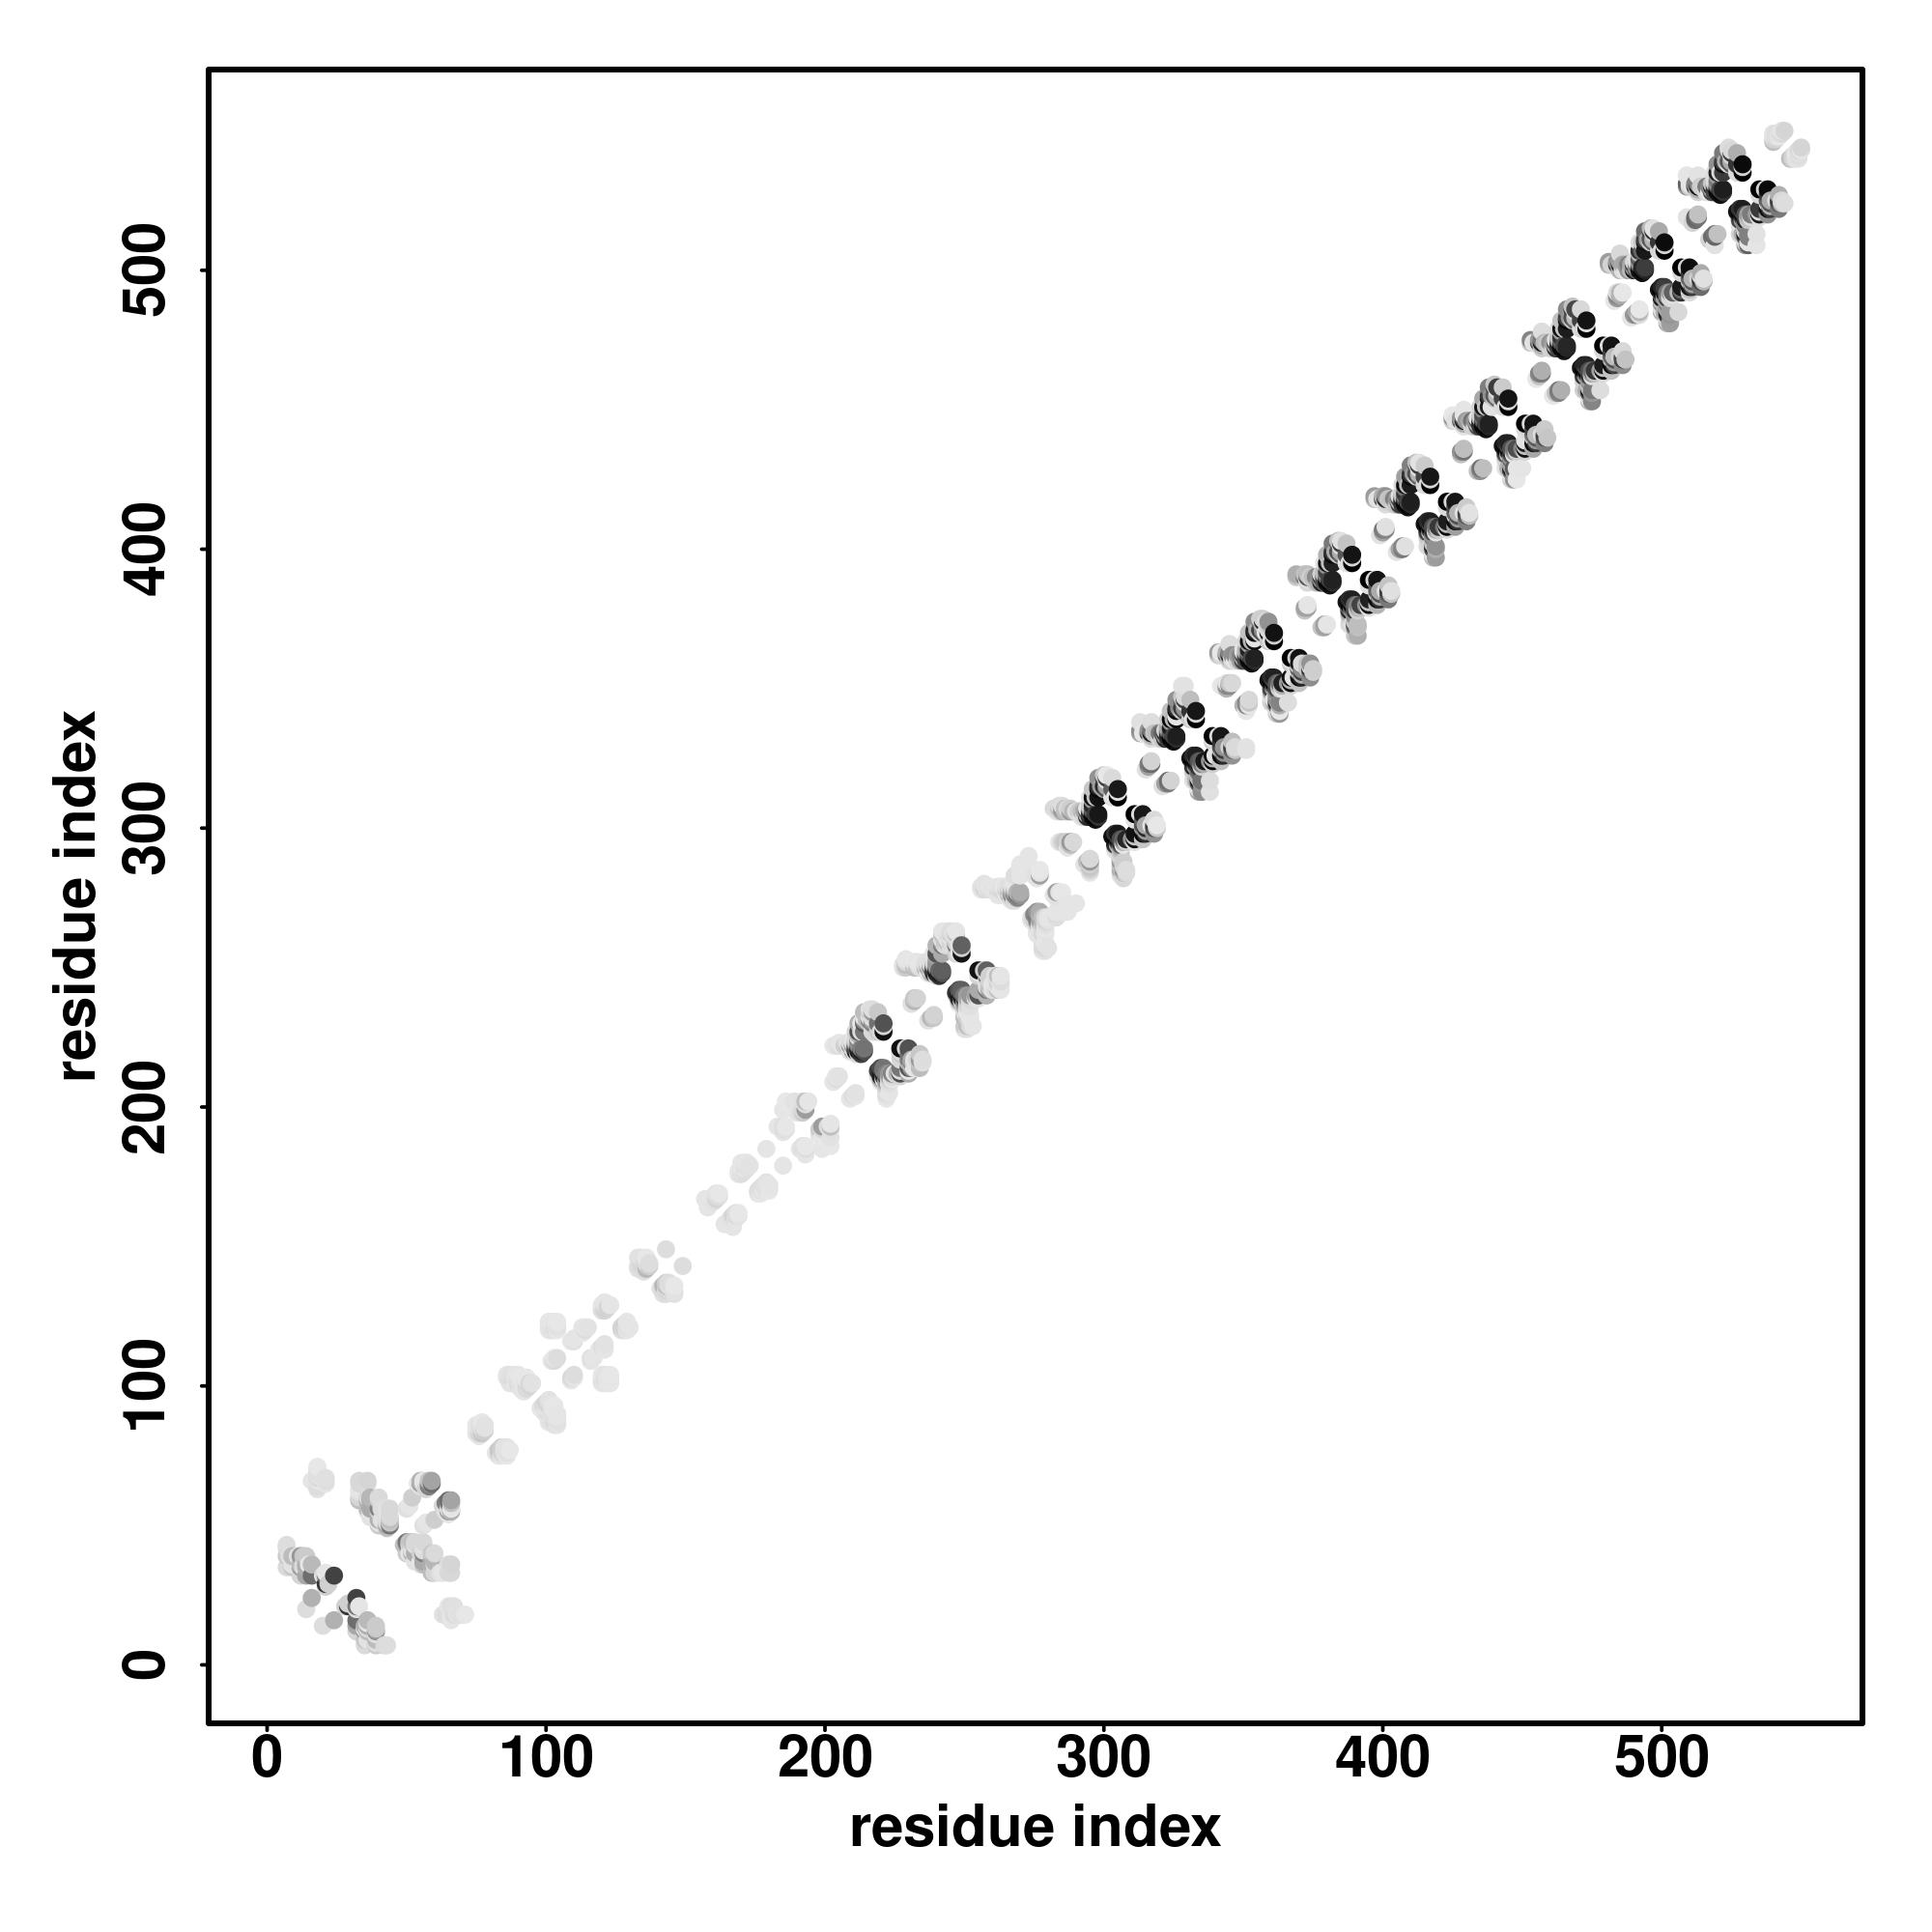
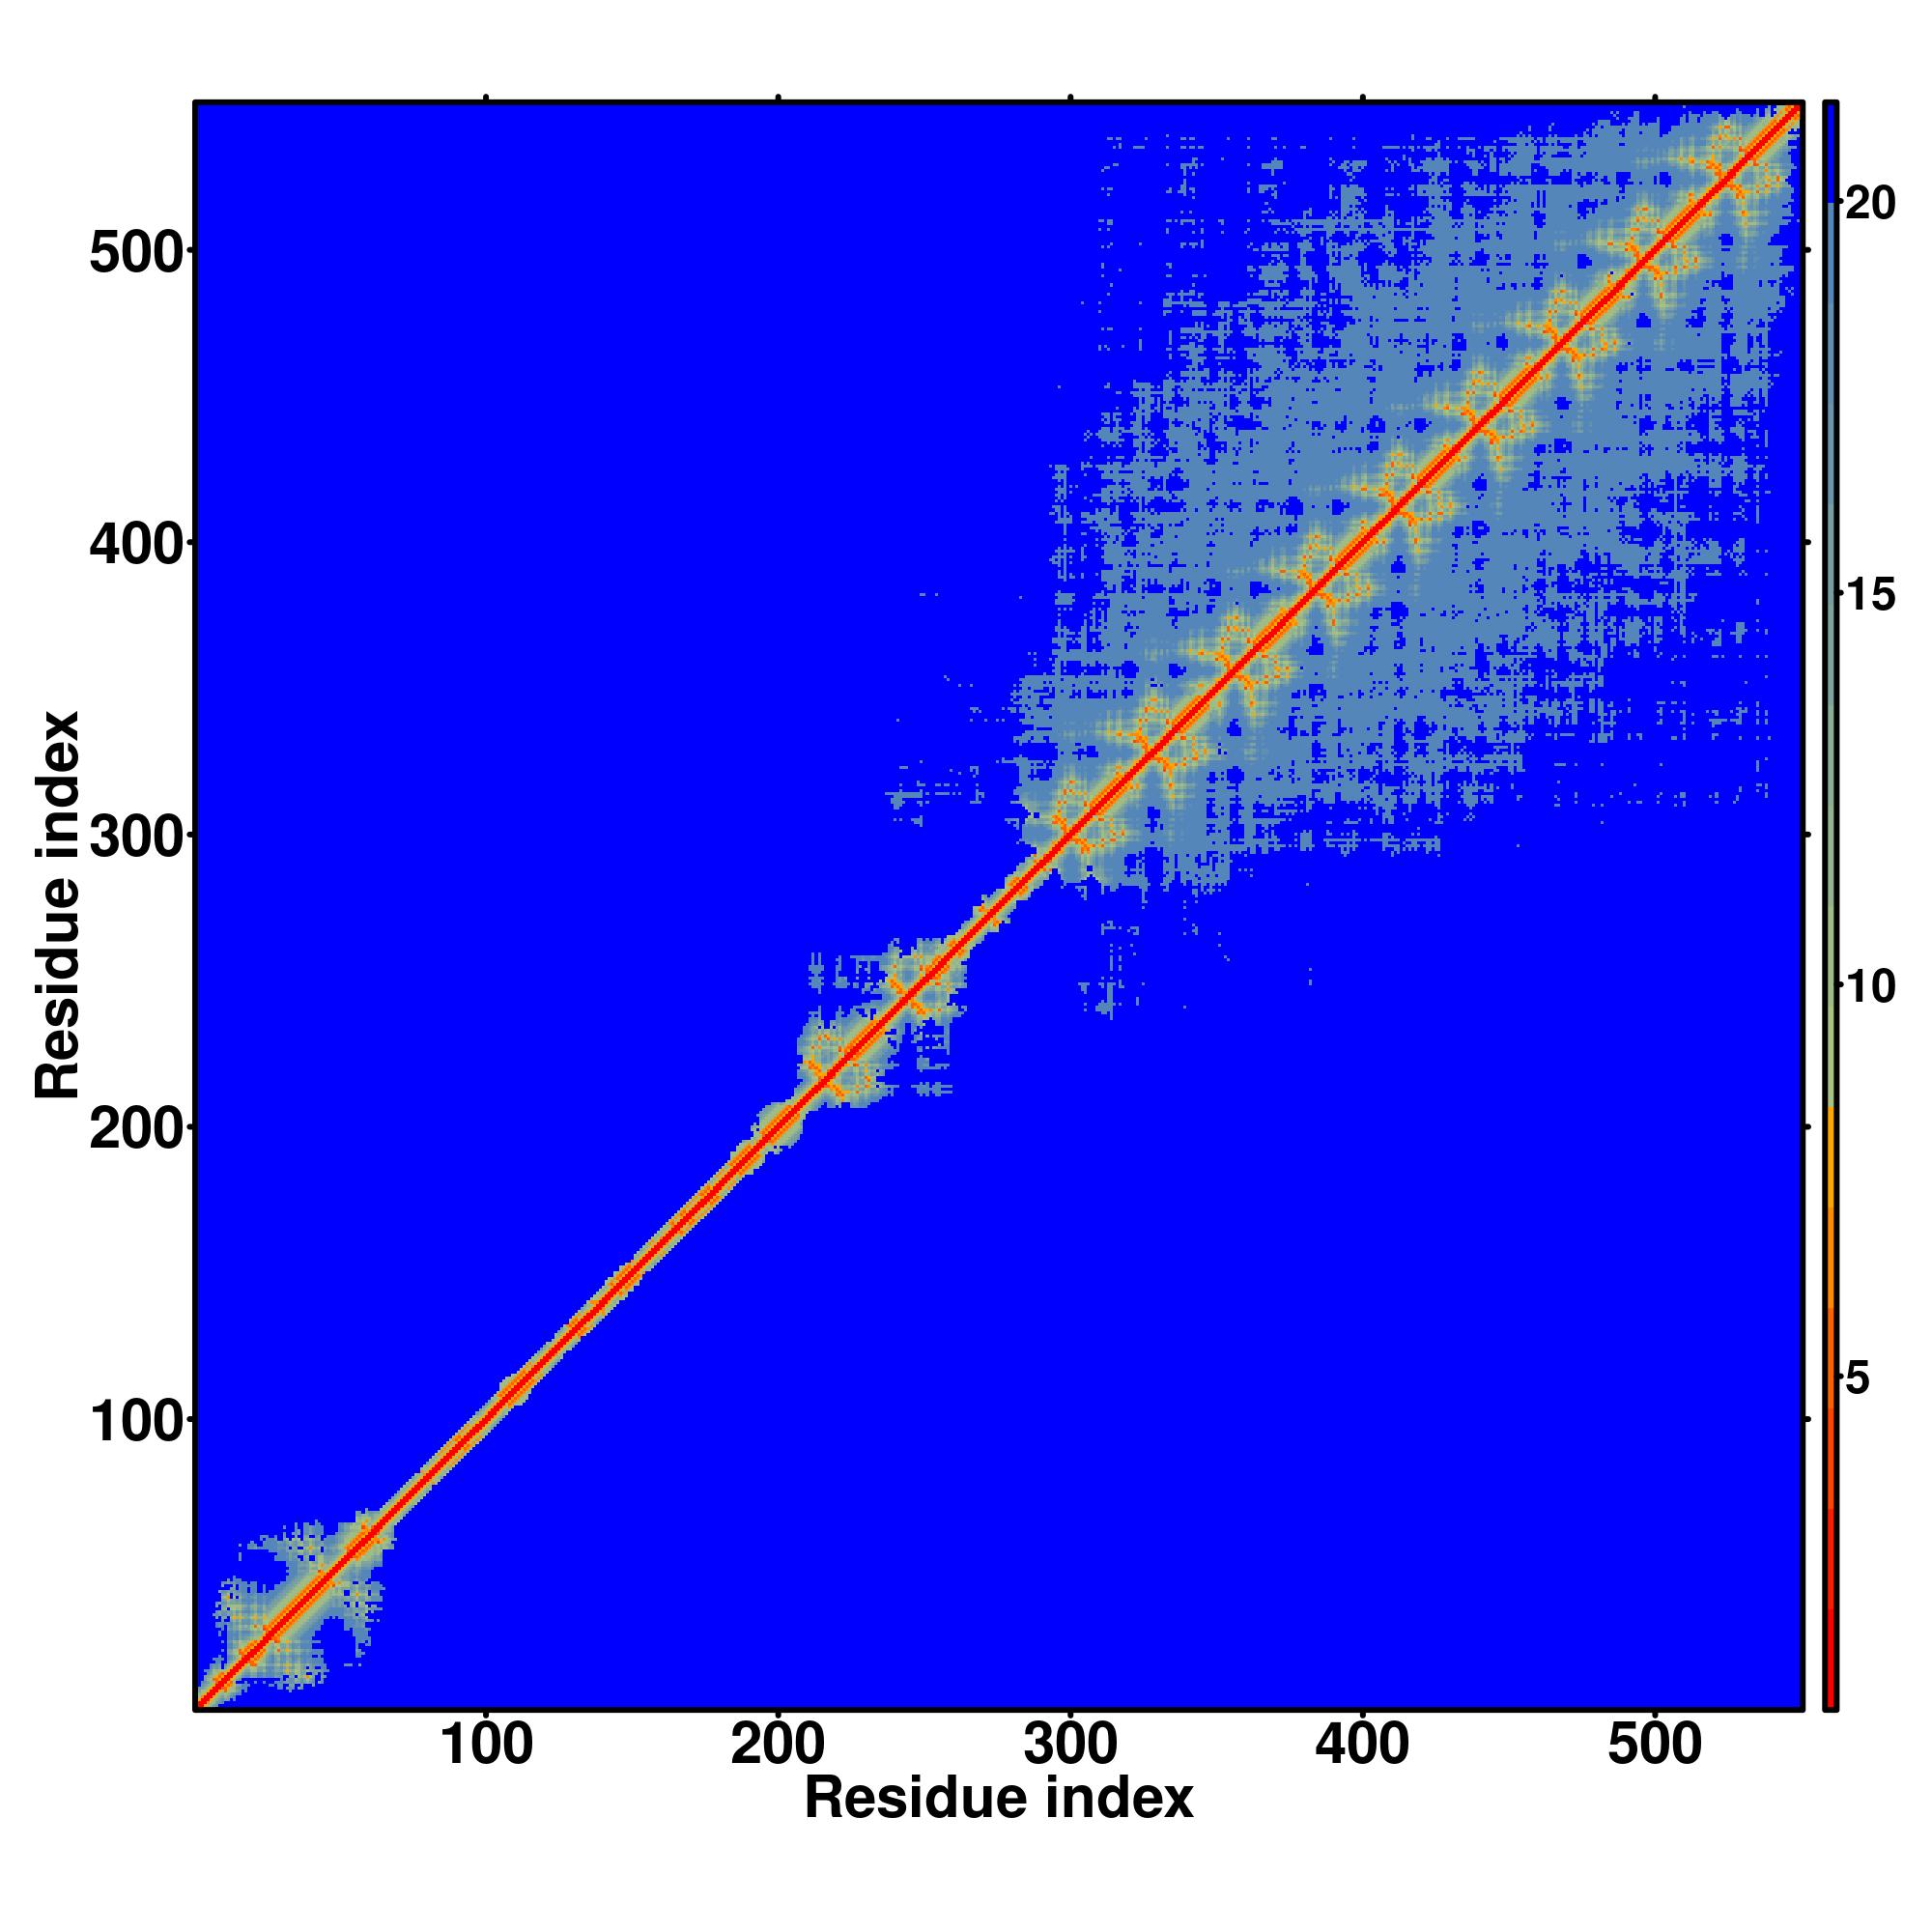
|
Template proteins with similar binding site:
Click
to view | Rank | CscoreLB | PDB
Hit | TM-score | RMSDa | IDENa | Cov. | BS-score | Lig. Name | Download
Complex | Predicted binding site residues |
|---|
| 1 | 0.01 | 2xjaB | 0.349 | 4.56 | 0.000 | 0.694 | 0.16 | ADP | complex1.pdb.gz | 11,12,13,14,15 |
| 2 | 0.01 | 3tw6C | 0.331 | 5.09 | 0.025 | 0.729 | 0.12 | COA | complex2.pdb.gz | 11,20,21 |
| 3 | 0.01 | 1ea0B | 0.433 | 4.28 | 0.104 | 0.847 | 0.14 | OMT | complex3.pdb.gz | 12,21,22,48 |
| 4 | 0.01 | 1sb8A | 0.449 | 4.22 | 0.053 | 0.835 | 0.11 | UD2 | complex4.pdb.gz | 5,28,30 |
| 5 | 0.01 | 1sb80 | 0.449 | 4.22 | 0.053 | 0.835 | 0.14 | III | complex5.pdb.gz | 14,15,18,22,23,26,27,67,70,71 |
| 6 | 0.01 | 2qf7A | 0.453 | 4.34 | 0.025 | 0.835 | 0.20 | COA | complex6.pdb.gz | 9,13,14 |
| 7 | 0.01 | 1ofdA | 0.427 | 4.09 | 0.066 | 0.824 | 0.30 | F3S | complex7.pdb.gz | 17,18,48 |
| 8 | 0.01 | 2qf7A | 0.453 | 4.34 | 0.025 | 0.835 | 0.21 | SAP | complex8.pdb.gz | 8,12,45 |
| | Click on the radio buttons to visualize predicted binding site and residues. |
| (a) | CscoreLB is the confidence score of predicted binding site. CscoreLB values range in between [0-1]; where a higher score indicates a more reliable ligand-binding site prediction. |
| (b) | BS-score is a measure of local similarity (sequence & structure) between template binding site and predicted binding site in the query structure. Based on large scale benchmarking analysis, we have observed that a BS-score >1 reflects a significant local match between the predicted and template binding site.
| | (c) | TM-score is a measure of global structural similarity between query and template protein. |
| (d) | RMSDa the RMSD between residues that are structurally aligned by TM-align. |
| (e) | IDENa is the percentage sequence identity in the structurally aligned region. |
| (f) | Cov. represents the coverage of global structural alignment and is equal to the number of structurally aligned residues divided by length of the query protein. |
|