About StarFunc
StarFunc independently generates five sets of Gene Ontology (GO) predictions for a query protein using five component methods:
Sequence homolog search through the UniProt-GOA database using BLASTp.
Structure alignment between the structure of the query protein and template structure from the BioLiP2 and AlphaFold databases by Foldseek plus TM-align.
Protein-protein interaction (PPI) partners recorded by the STRING database.
Logistic regression models (one model per GO term) which use Pfam family matches as the input features.
Prediction from a deep learning model (InterLabelGO), which is an update of our previously developed ATGO model.
The prediction scores from these five components, as well as the background frequency of the GO term in the UniProt-GOA database, are used as six input features to apply
random forest models (five models per GO aspect of MF, BP and CC) to derive the consensus score used for final function predictions.

Server Input
The user must upload a PDB formatted structure file of query protein. User have the option to either paste the PDB file in the provided form or upload the file using the browse button. If the PDB file contains multiple protein chains and/or multiple models, first protein chain of the first model will be automatically selected by the program, and all other chains will be ignored. Providing an e-mail address is recommended for receiving the prediction results.
Server Output
The output webpage contains six annotations panels.
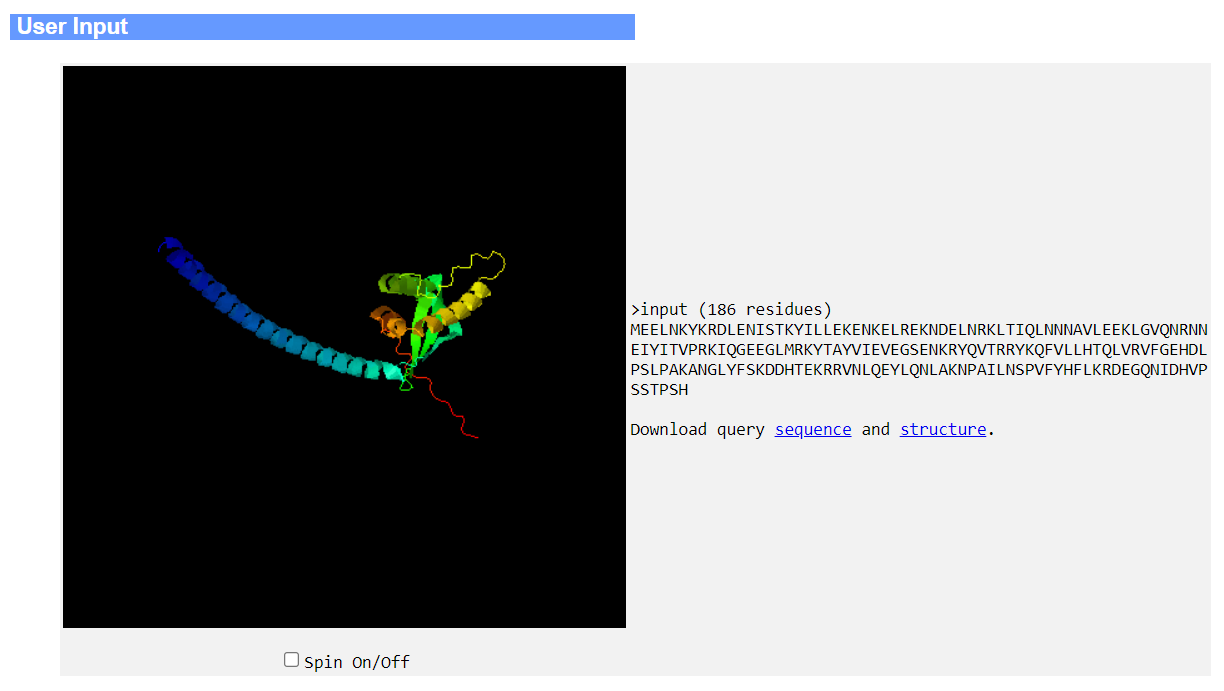
The first panel shows the sequence and structure of the input protein.
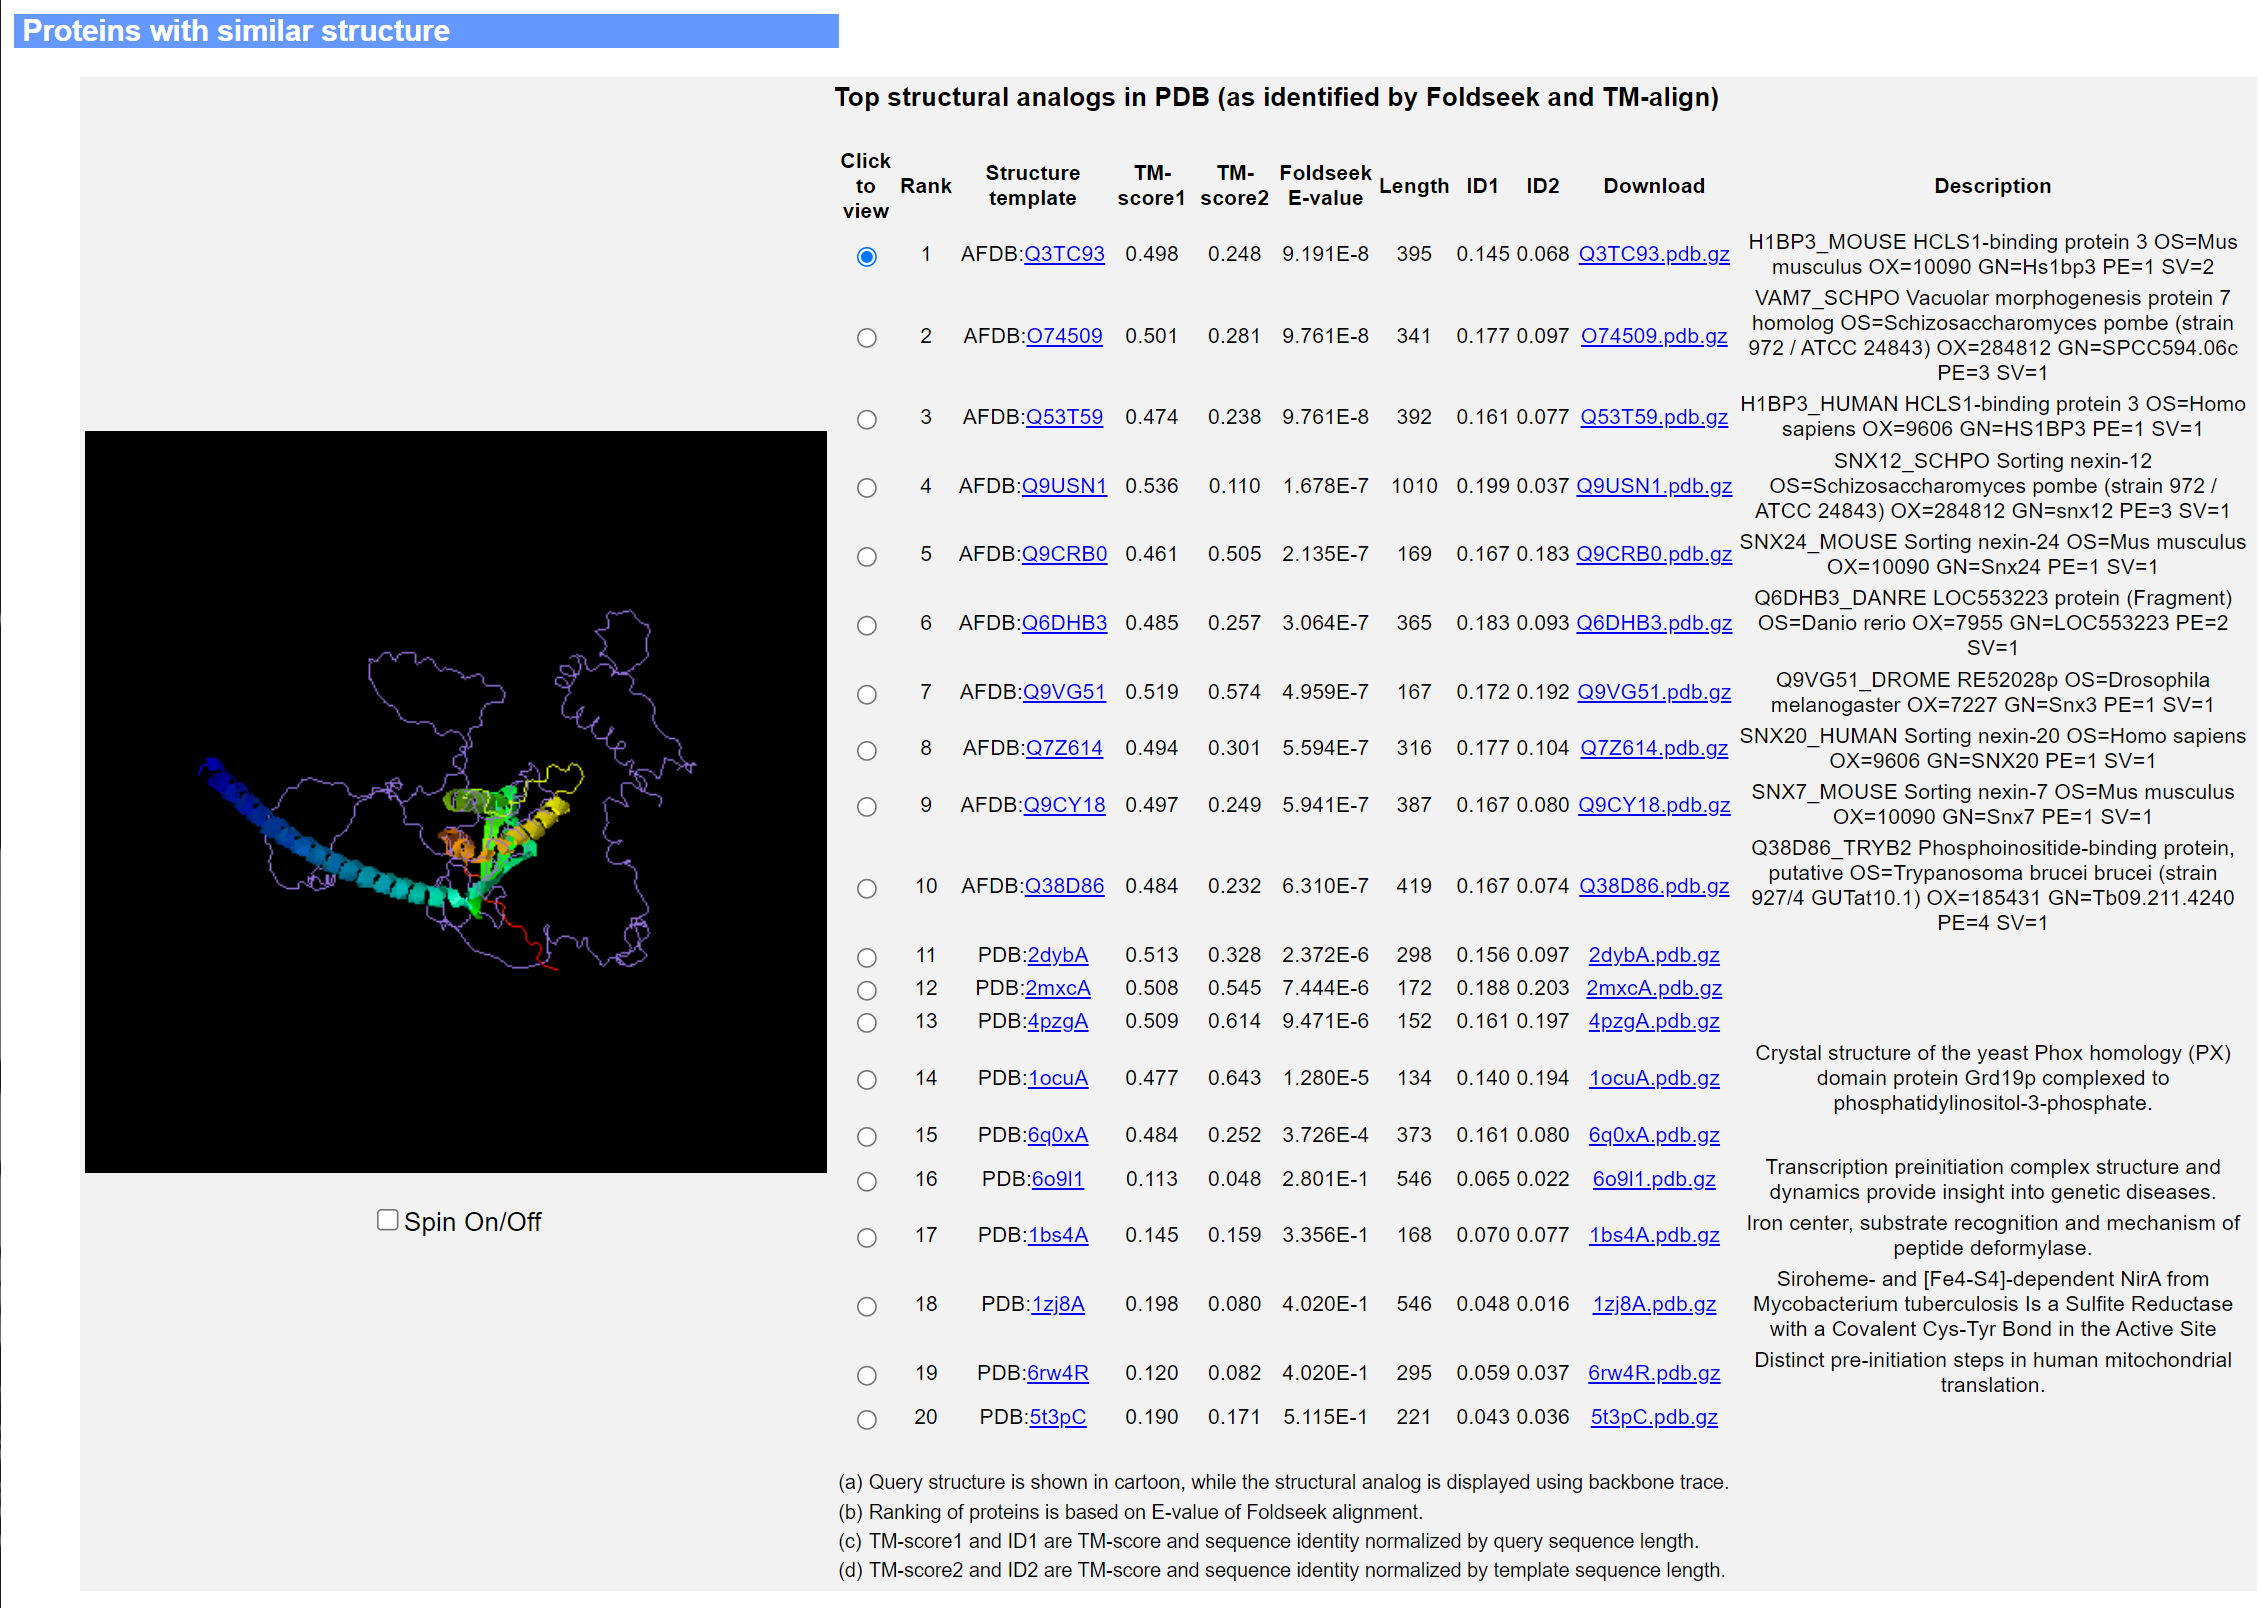
 The second panel lists the top 20 structure templates from AFDB and BioLiP2, together with their TM-scores, Foldseek E-values, sequence identities calculated from the TM-align alignment, and a description of each matching protein drawn from either the UniProt database (for AFDB templates) or the PDB database (for BioLiP2 templates). The template structure (purple ribbon) superimposed onto the query structure (rainbow cartoon) is shown on the left hand side of the panel.
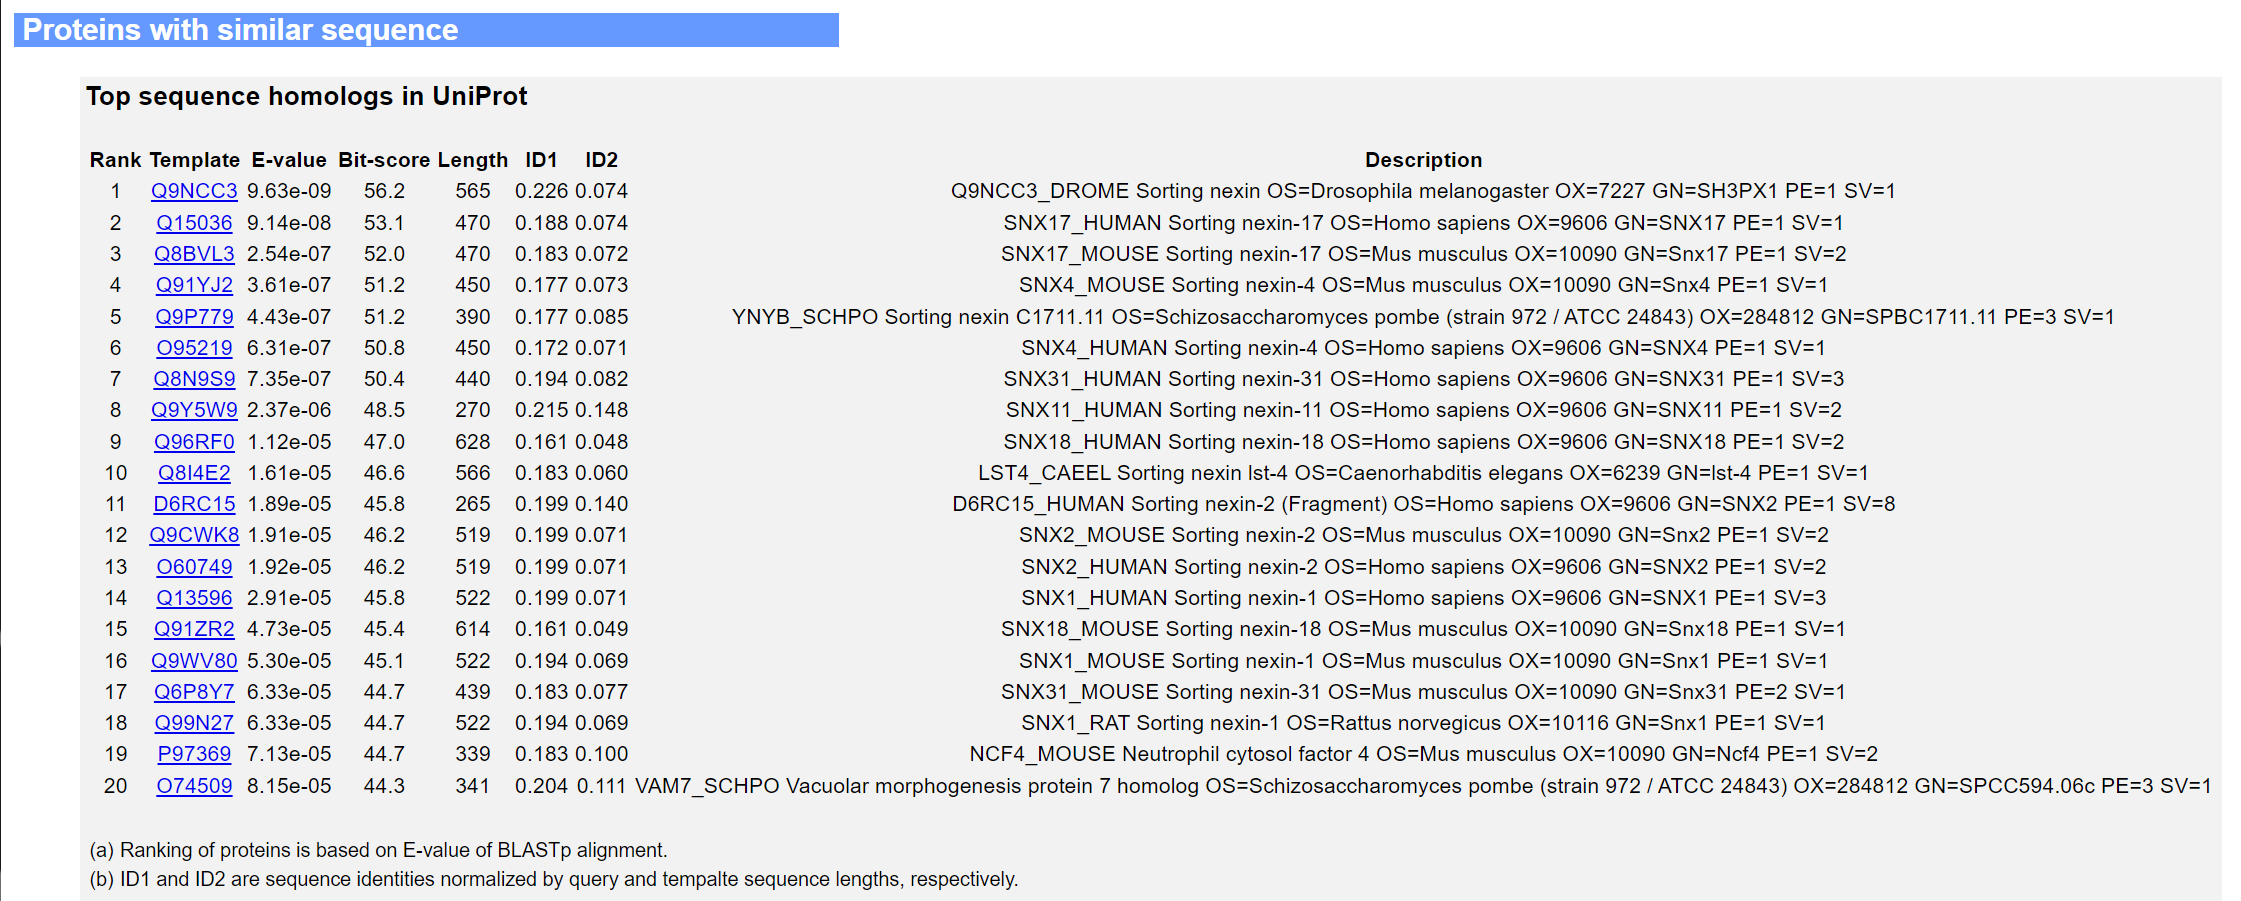
 The third panel lists the top 20 hits from a BLASTp search through UniProt-GOA, together with their E-values, bit-scores, sequence identities and description from UniProt.
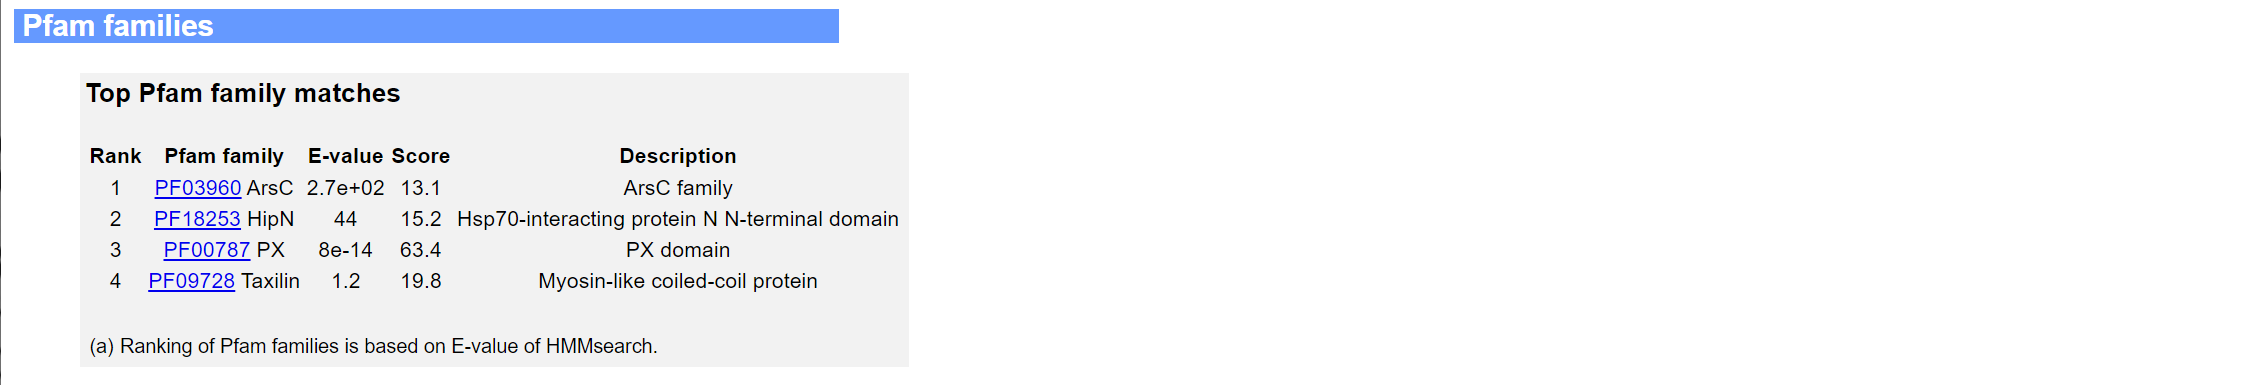
 The fourth panel shows the matching Pfam families as well as the scores and E-values reported by HMMsearch.
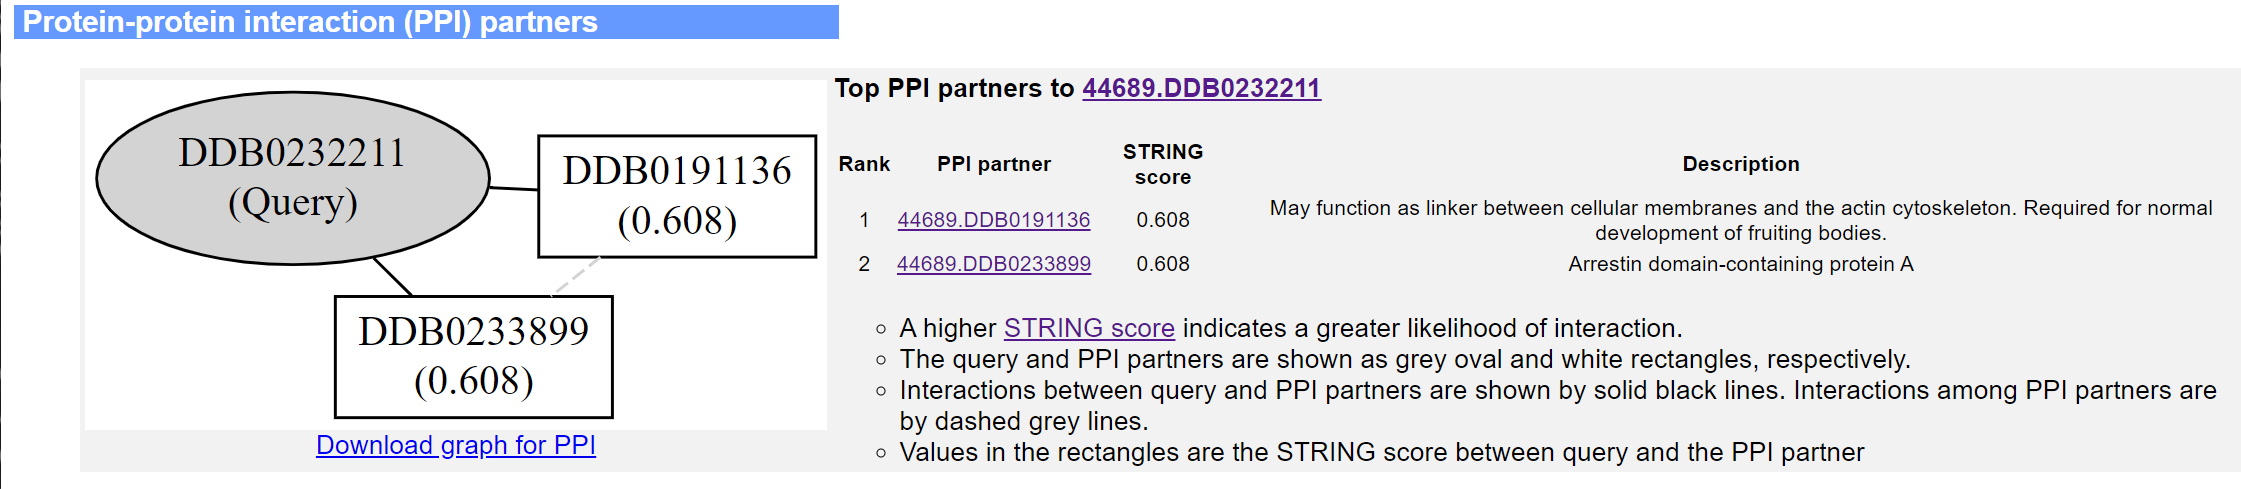
 The fifth panel shows all PPI partners in the STRING database with STRING score≥0.5, their STRING scores and descriptions. An interaction graph showing the PPIs among the target protein and the PPI partners is drawn at the left-hand side of the panel.
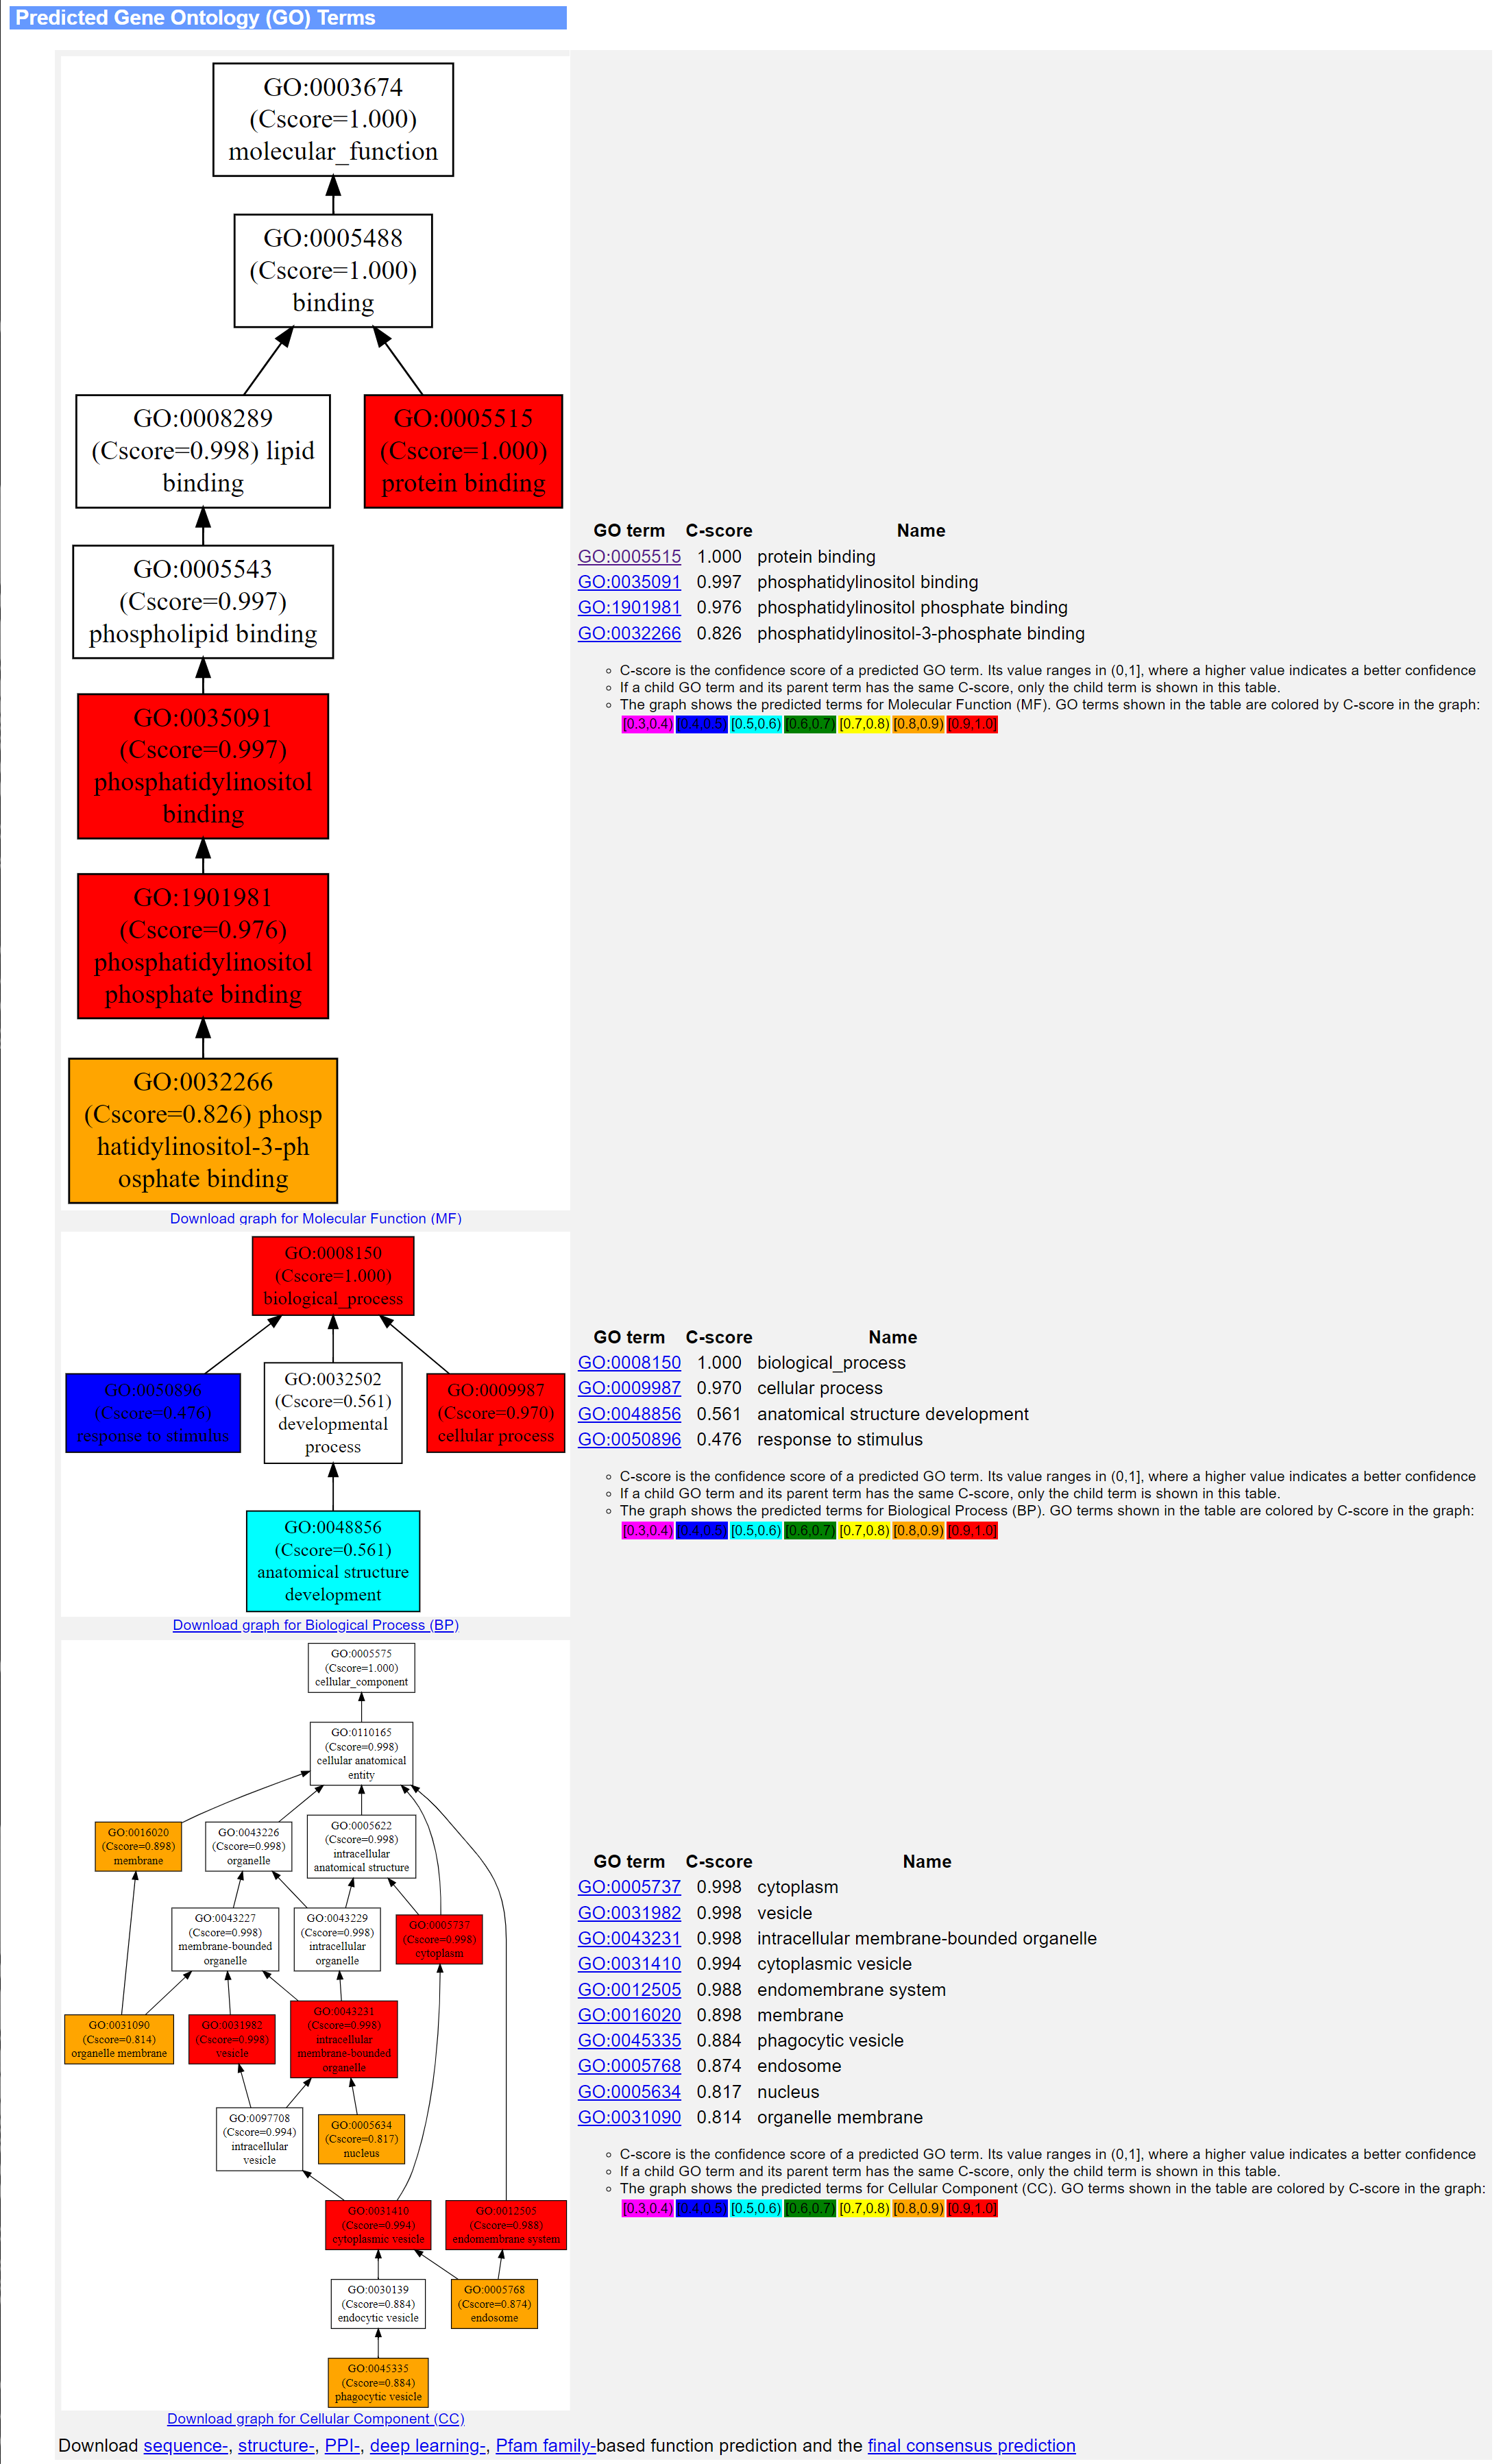
 The sixth panel shows the predicted GO terms in three separate tables which correspond to the MF, BP and CC aspects of GO. Within each table, the GO terms, as well as their predicted scores and descriptions, are sorted in descending order of predicted scores. If both a parent term and a child term have the same prediction score, only the child term is listed. Meanwhile, a directed acyclic graph showing the predictions for each GO aspect is drawn at the left-hand side of the term list for each GO aspect.