[Home]
[Back to DMFold server]
[Help]
DMFold results for example
[Click result.zip to download all results on this page]
|
Input Sequence In FASTA Format
|
example ( 1221 residues )
|
>example-A
EIMPLTLKVNGKTEQLEVDTRTTLLDTLRENLHLIGTKKGCDHGQCGACTVLVNGRRLNACLTLAVMHQGAEITTIEGLGSPDNLHPMQAAFIKHDGFQCGYCTSGQICSSVAVLKEIQDGIPSHVTVDLVSAPETTADEIRERMSGNICRCGAYANILAAIEDAAGEIKS
>example-B
MKAFTYERVNTPAEAALSAQRVPGAKFIAGGTNLLDLMKLEIETPTHLIDVNGLGLDKIEVTDAGGLRIGALVRNTDLAAHERVRRDYAVLSRALLAGASGQLRNQATTAGNLLQRTRCPYFYDTNQPCNKRLPGSGCAALEGFSRQHAVVGVSEACIATHPSDMAVAMRLLDAVVETITPEGKTRSITLADFYHPPGKTPHIETALLPGELIVAVTLPPPLGGKHIYRKVRDRASYAFALVSVAAIIQPDGSGRVALGGVAHKPWRIEAADAQLSQGAQAVYDTLFASAHPTAENTFKLLLAKRTLASVLAEARAQA
>example-C
MKFDKPAGENPIDQLKVVGRPHDRIDGPLKTTGTARYAYEWHEEAPNAAYGYIVGSAIAKGRLTALDTDAAQKAPGVLAVITASNAGALGKGDKNTARLLGGPTIEHYHQAIALVVAETFEQARAAASLVQAHYRRNKGAYSLADEKQAVNQPPEDTPDKNVGDFDGAFTSAAVKIDATYTTPDQSHMAMEPHASMAVWDGNKLTLWTSNQMIDWCRTDLAKTLKVPVENVRIISPYIGGGFGGKLFLRSDALLAALAARAVKRPVKVMLPRPSIPNNTTHRPATLQHLRIGADQSGKITAISHESWSGNLPGGTPETAVQQSELLYAGANRHTGLRLATLDLPEGNAMRAPGEAPGLMALEIAIDELAEKAGIDPVEFRILNDTQVDPADPTRCFSRRQLIECLRTGADKFGWKQRNATPGQVRDGEWLVGHGVAAGFRNNLLEKSGARVHLEQNGTVTVETDMTDIGTGSYTILAQTAAEMLGVPLEQVAVHLGDSSFPVSAGSGGQWGANTSTSGVYAACMKLREMIASAVGFDPEQSQFADGKITNGTRSATLHEATAGGRLTAEESIEFGTLSKEYQQSTFAGHFVEVGVHSATGEVRVRRMLAVCAAGRILNPKTARSQVIGAMTMGMGAALMEELAVDDRLGYFVNHDMAGYEVPVHADIPKQEVIFLDDTDPISSPMKAKGVGELGLCGVSAAIANAVYNATGIRVRDYPITLDKLLDKLPDVV
|
|
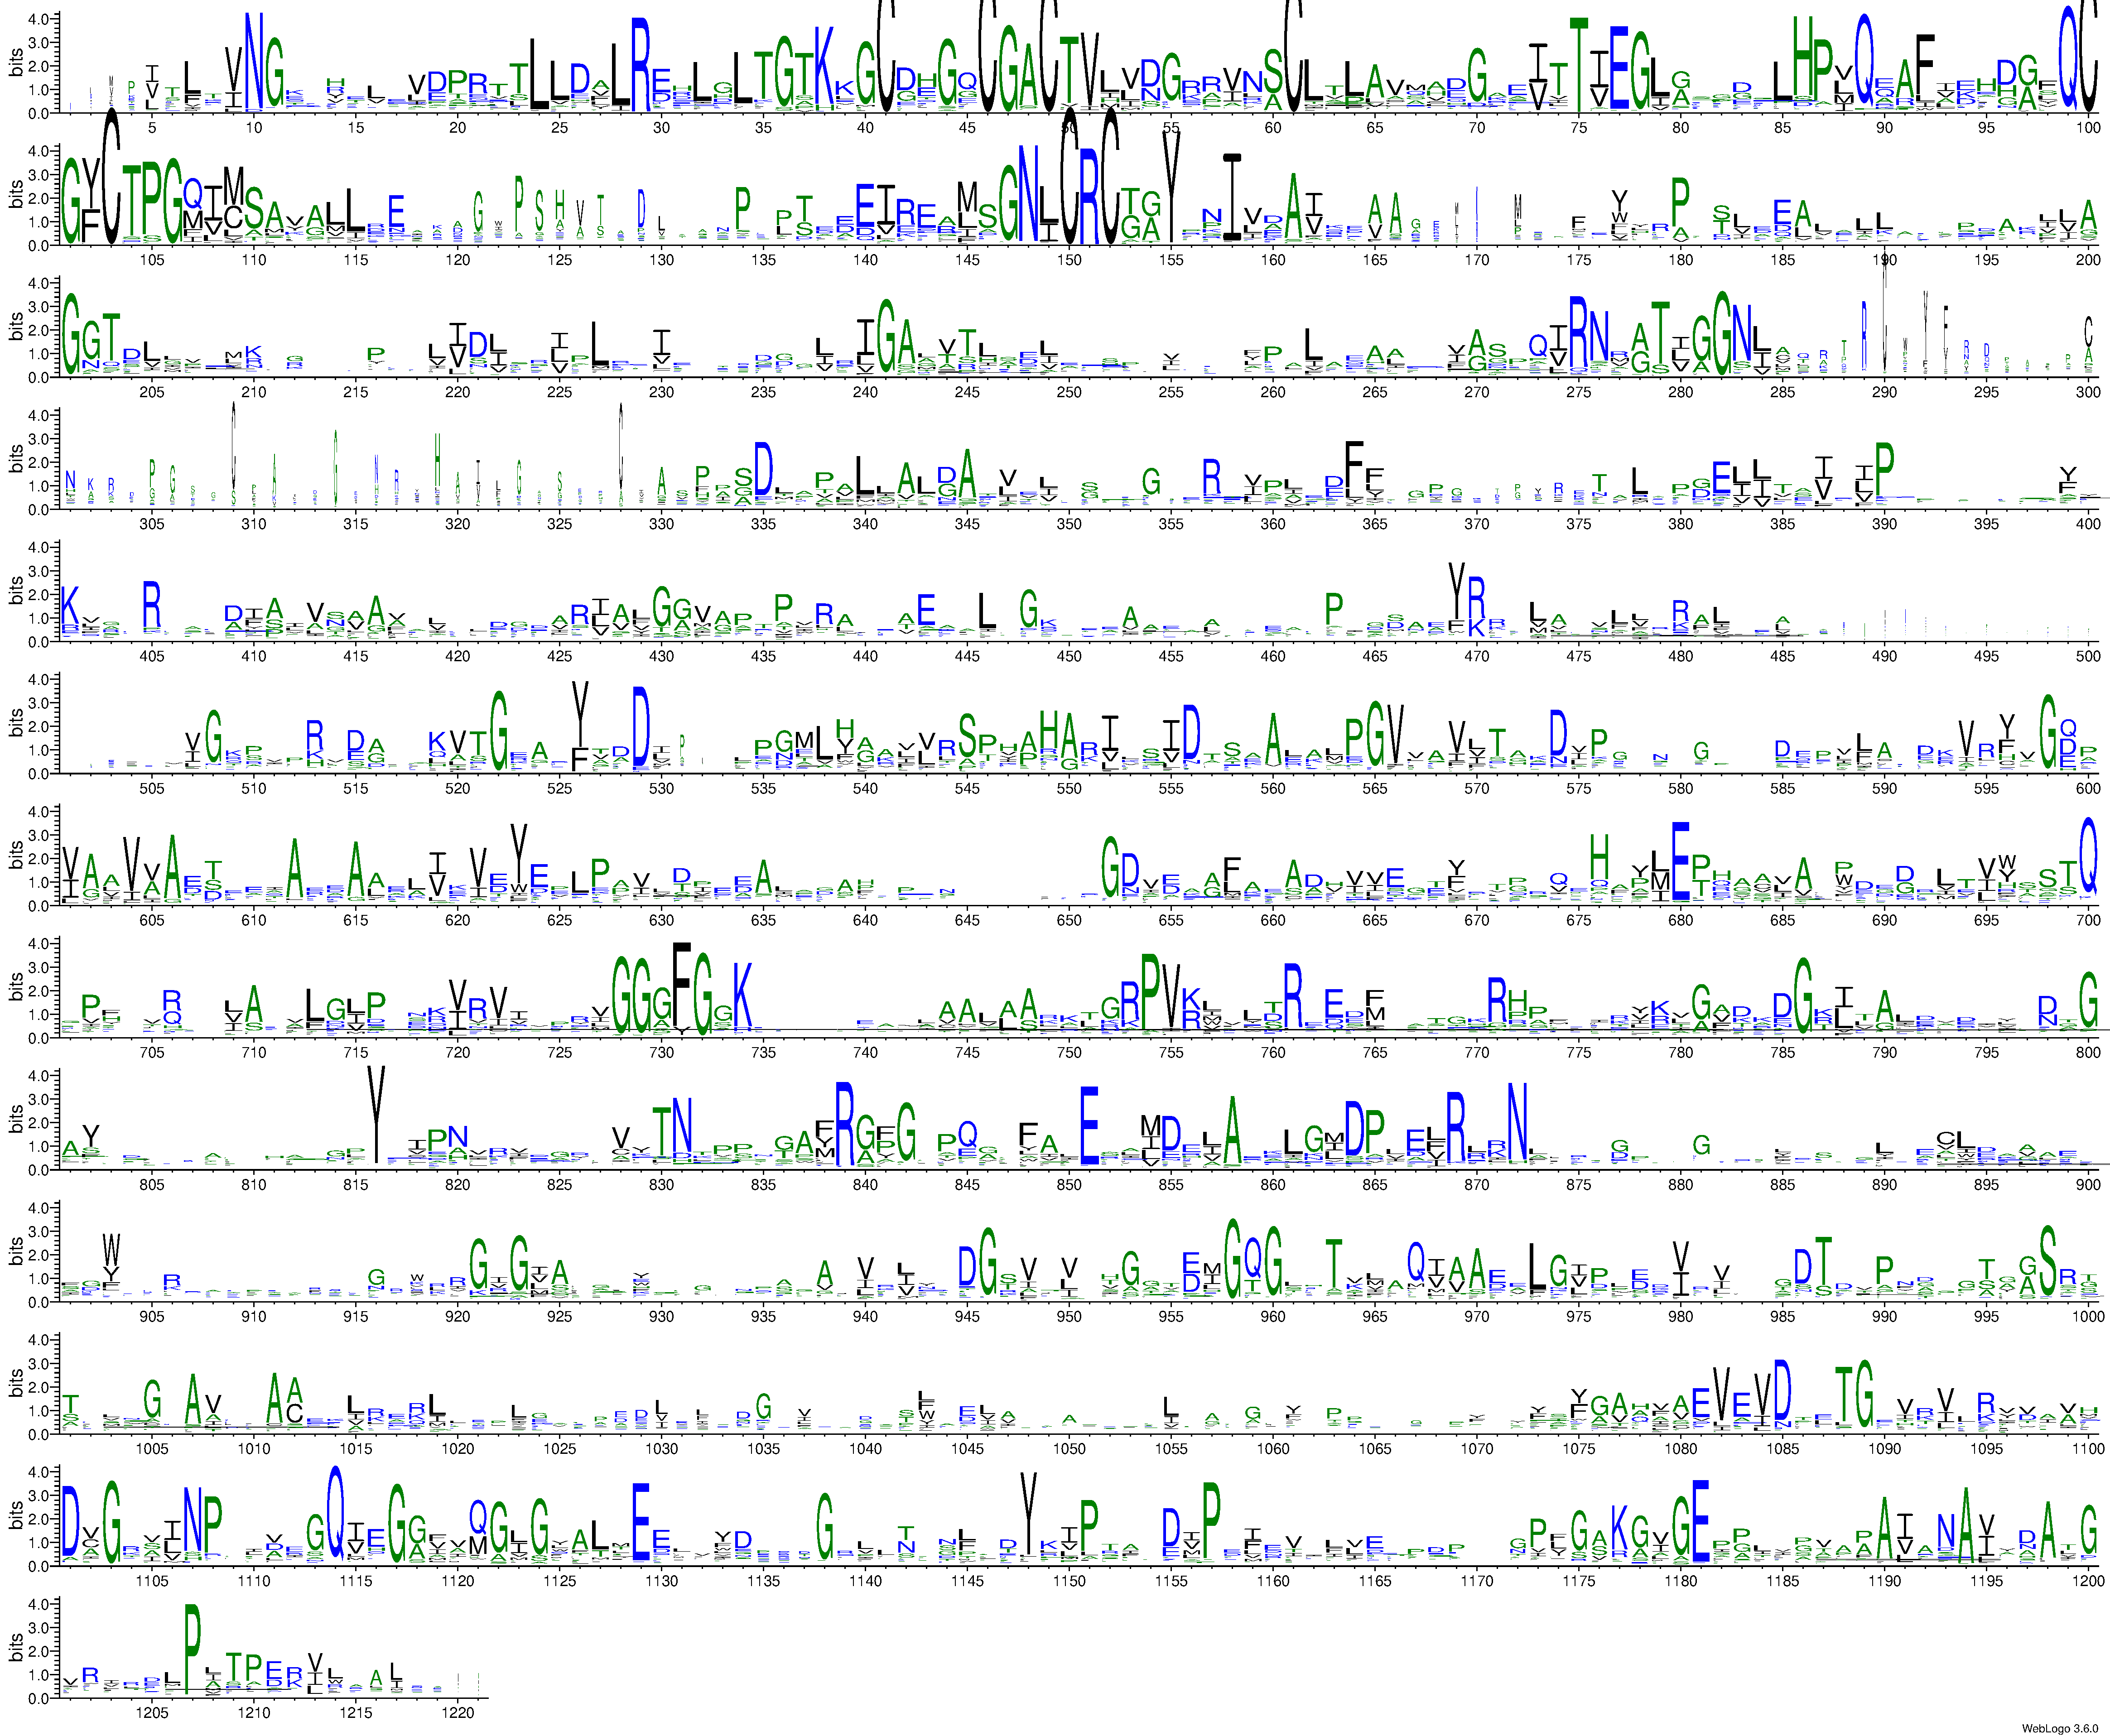
Multiple Sequence Alignments
|
|
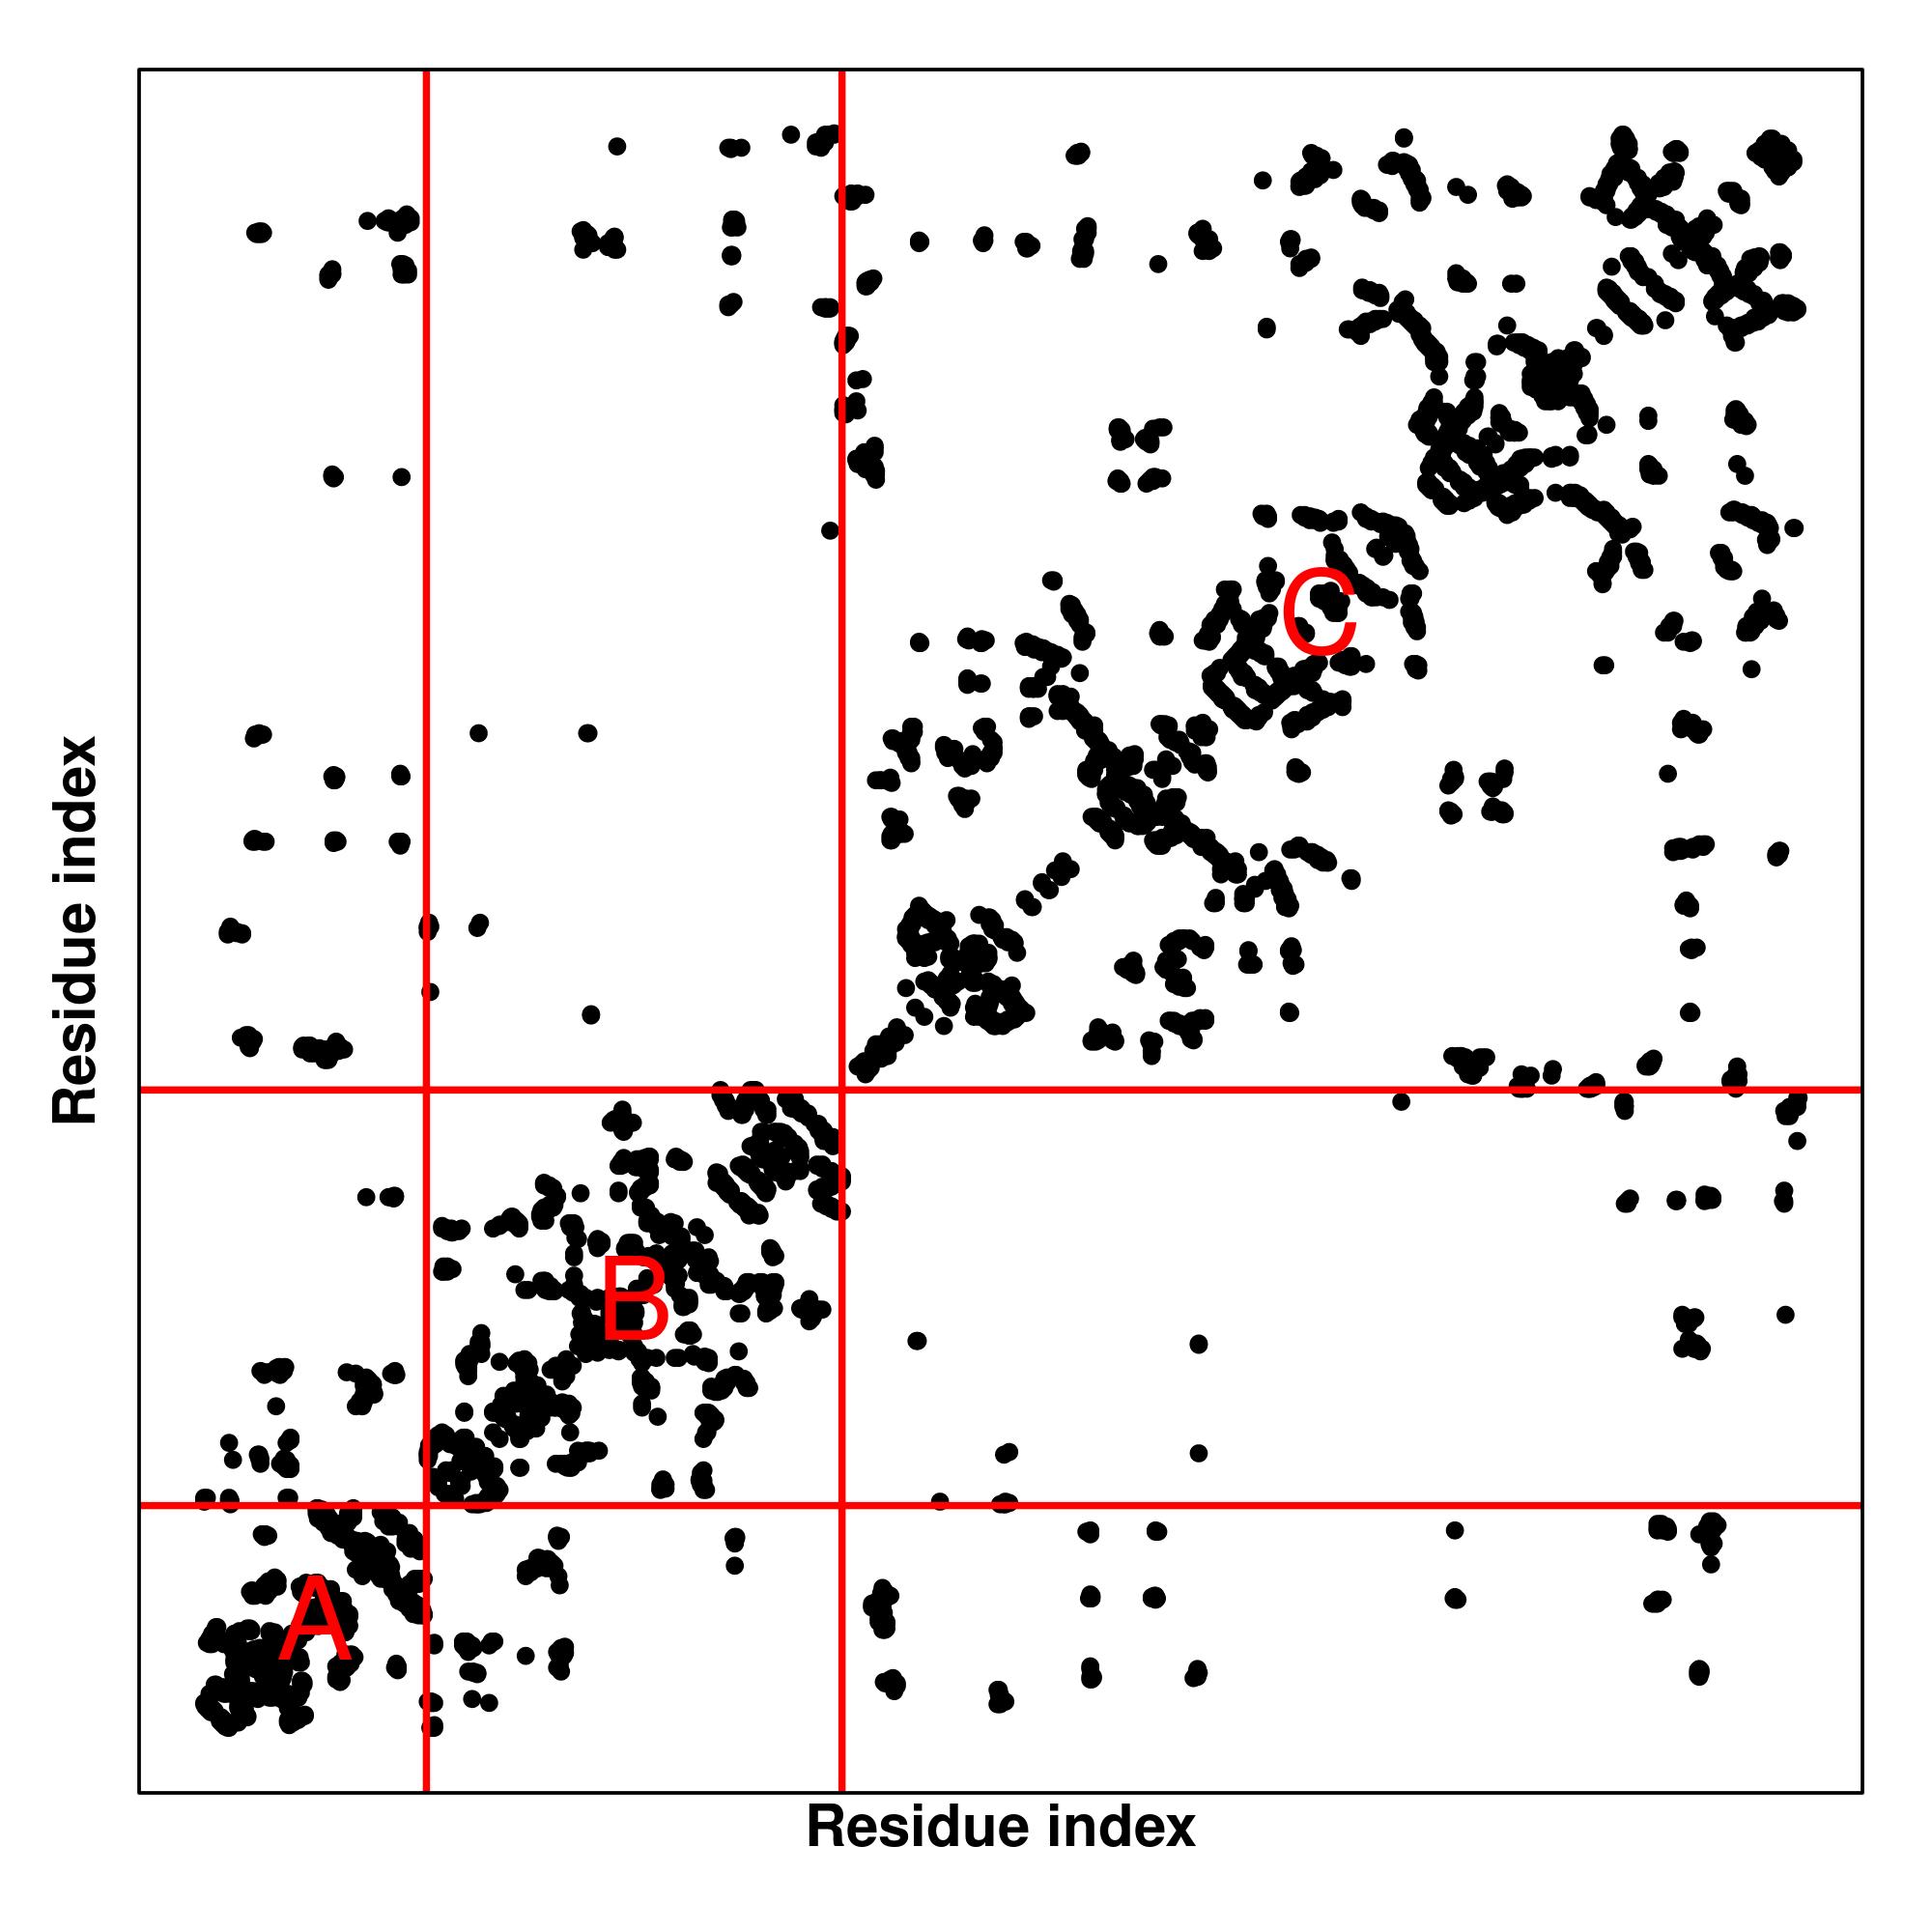
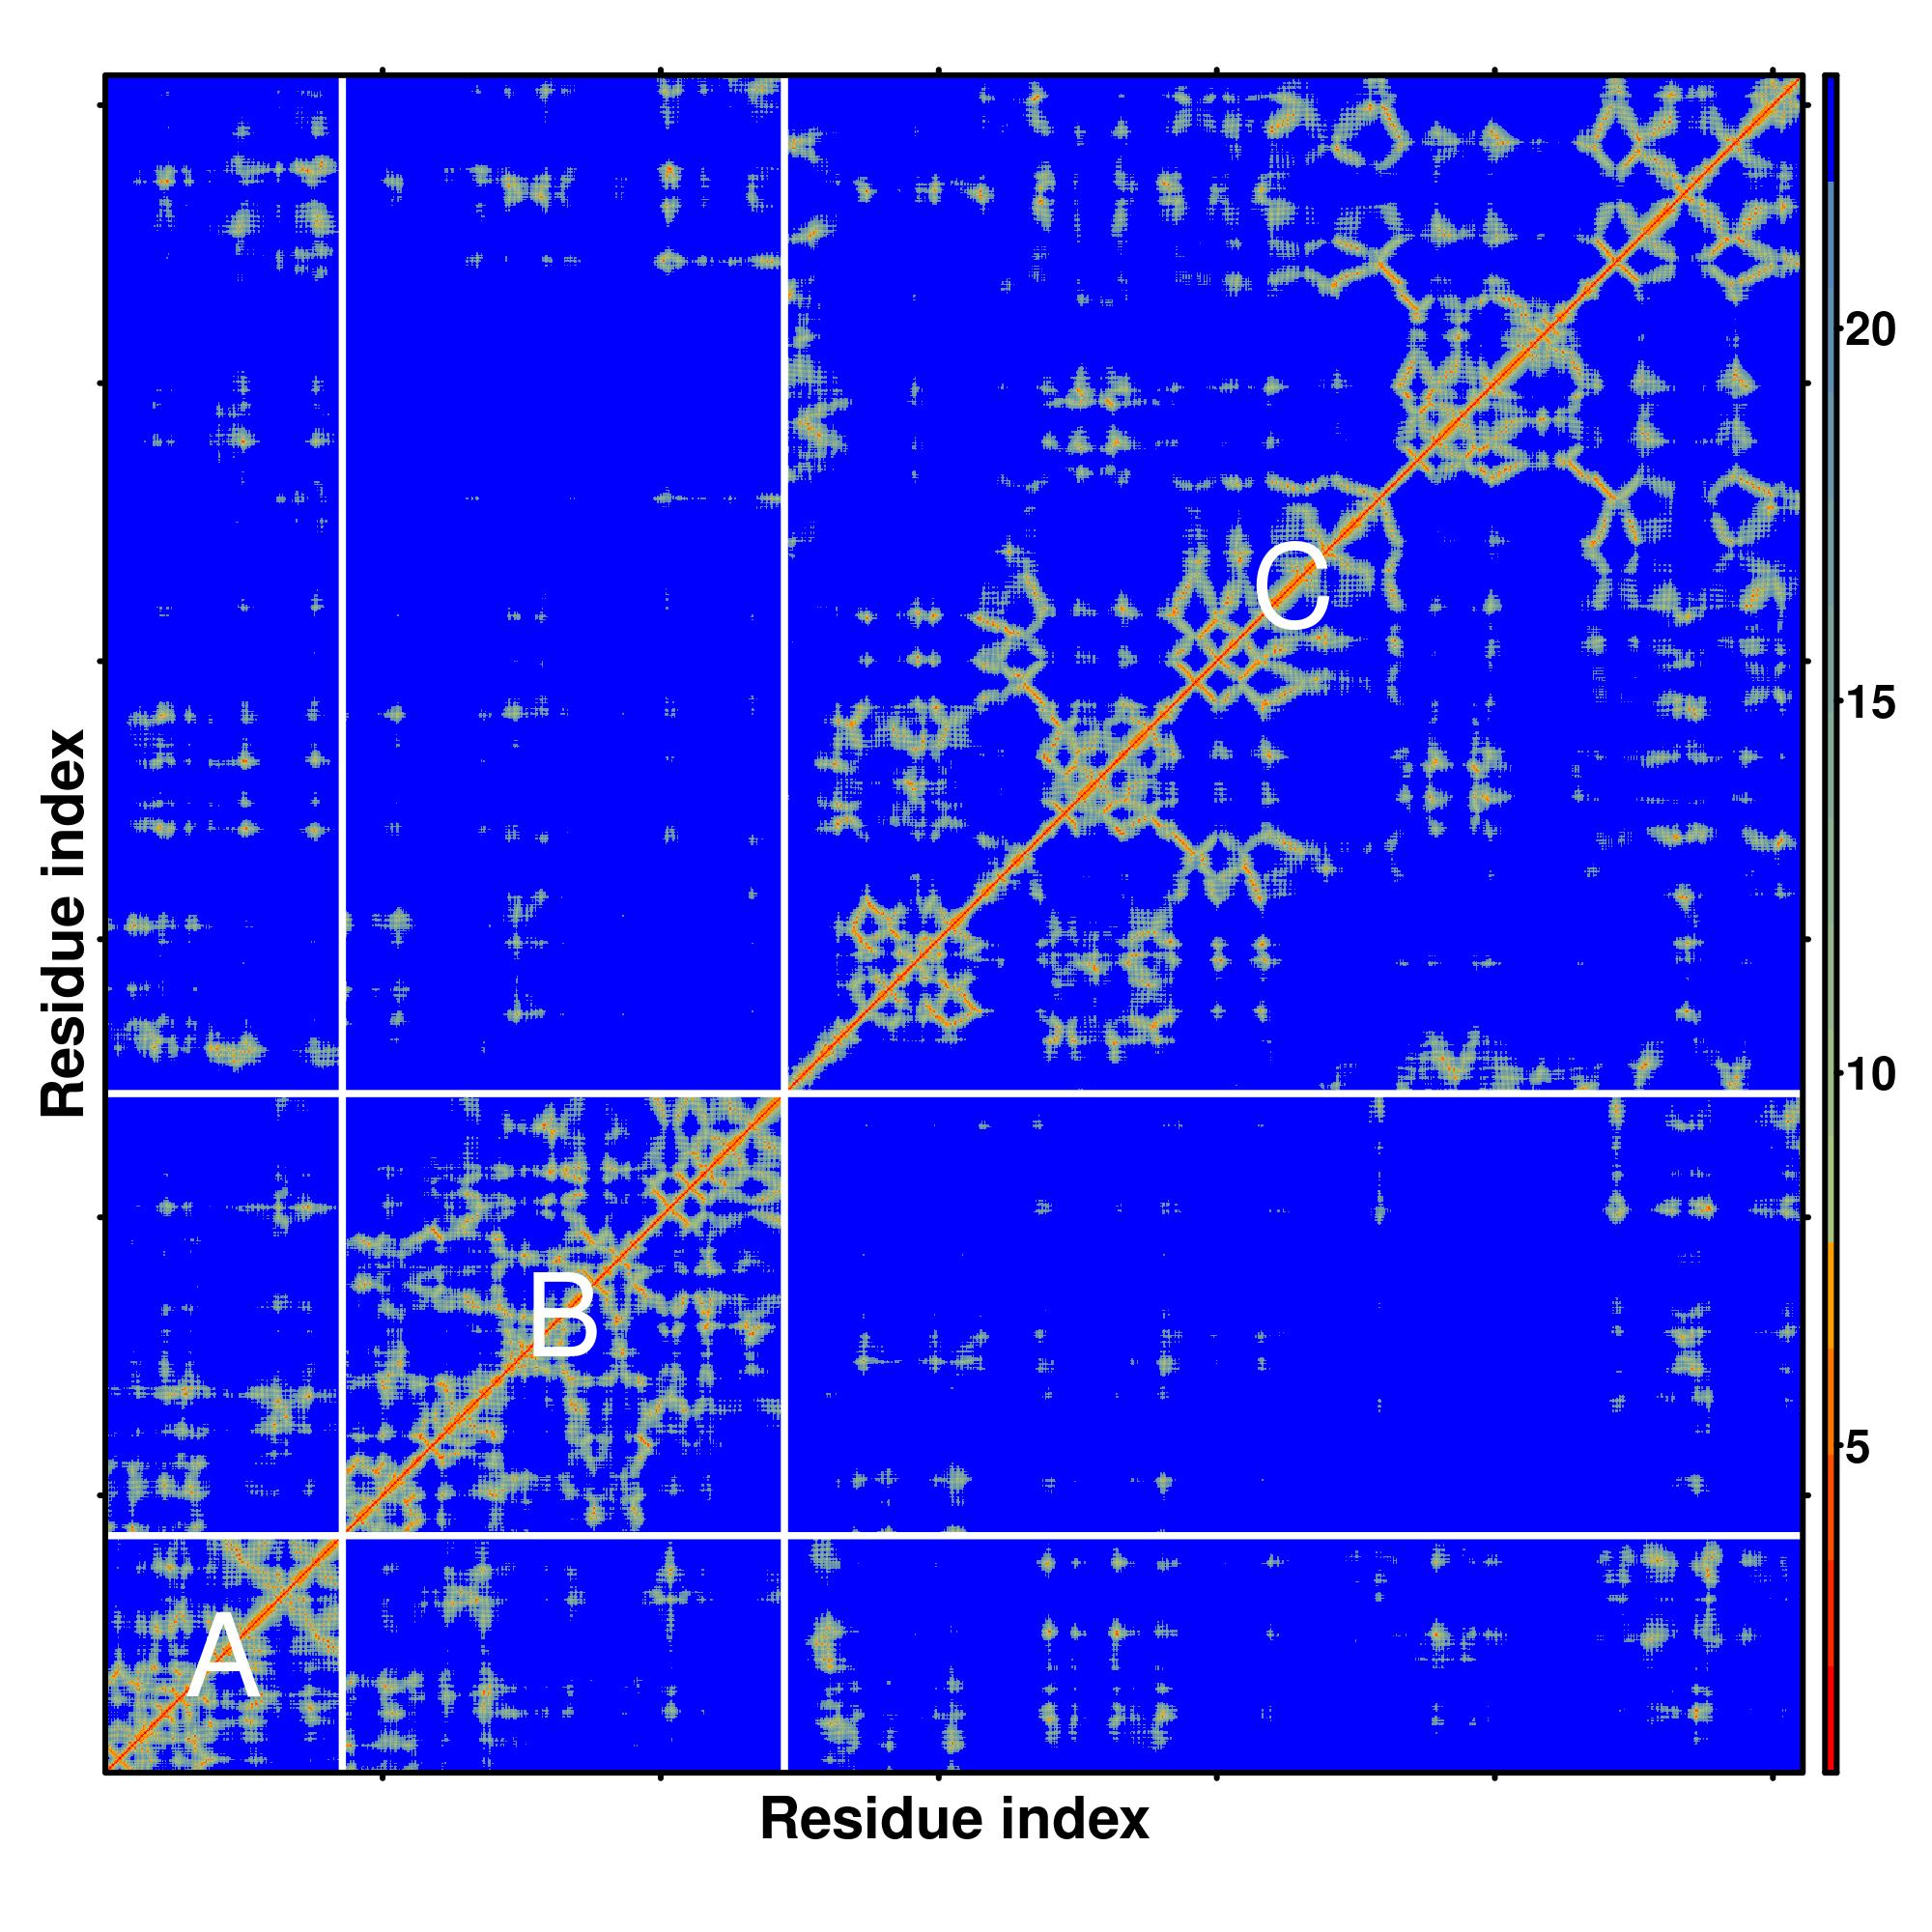
Predicted Contact And Distance Map
|
Contact Map
|
Distance Map
|
|
Individual Chain Modeling Results
|
| ID. of chain |
chain |
Length of chain |
pLDDT |
Models of Chain |
Sequence |
| A |
example-model1-A |
171 |
0.97 |
 |
EIMPLTLKVNGKTEQLEVDTRTTLLDTLRENLHLIGTKKGCDHGQCGACTVLVNGRRLNACLTLAVMHQGAEITTIEGLGSPDNLHPMQAAFIKHDGFQCGYCTSGQICSSVAVLKEIQDGIPSHVTVDLVSAPETTADEIRERMSGNICRCGAYANILAAIEDAAGEIKS |
| B |
example-model1-B |
318 |
0.97 |
 |
MKAFTYERVNTPAEAALSAQRVPGAKFIAGGTNLLDLMKLEIETPTHLIDVNGLGLDKIEVTDAGGLRIGALVRNTDLAAHERVRRDYAVLSRALLAGASGQLRNQATTAGNLLQRTRCPYFYDTNQPCNKRLPGSGCAALEGFSRQHAVVGVSEACIATHPSDMAVAMRLLDAVVETITPEGKTRSITLADFYHPPGKTPHIETALLPGELIVAVTLPPPLGGKHIYRKVRDRASYAFALVSVAAIIQPDGSGRVALGGVAHKPWRIEAADAQLSQGAQAVYDTLFASAHPTAENTFKLLLAKRTLASVLAEARAQA |
| C |
example-model1-C |
732 |
0.99 |
 |
MKFDKPAGENPIDQLKVVGRPHDRIDGPLKTTGTARYAYEWHEEAPNAAYGYIVGSAIAKGRLTALDTDAAQKAPGVLAVITASNAGALGKGDKNTARLLGGPTIEHYHQAIALVVAETFEQARAAASLVQAHYRRNKGAYSLADEKQAVNQPPEDTPDKNVGDFDGAFTSAAVKIDATYTTPDQSHMAMEPHASMAVWDGNKLTLWTSNQMIDWCRTDLAKTLKVPVENVRIISPYIGGGFGGKLFLRSDALLAALAARAVKRPVKVMLPRPSIPNNTTHRPATLQHLRIGADQSGKITAISHESWSGNLPGGTPETAVQQSELLYAGANRHTGLRLATLDLPEGNAMRAPGEAPGLMALEIAIDELAEKAGIDPVEFRILNDTQVDPADPTRCFSRRQLIECLRTGADKFGWKQRNATPGQVRDGEWLVGHGVAAGFRNNLLEKSGARVHLEQNGTVTVETDMTDIGTGSYTILAQTAAEMLGVPLEQVAVHLGDSSFPVSAGSGGQWGANTSTSGVYAACMKLREMIASAVGFDPEQSQFADGKITNGTRSATLHEATAGGRLTAEESIEFGTLSKEYQQSTFAGHFVEVGVHSATGEVRVRRMLAVCAAGRILNPKTARSQVIGAMTMGMGAALMEELAVDDRLGYFVNHDMAGYEVPVHADIPKQEVIFLDDTDPISSPMKAKGVGELGLCGVSAAIANAVYNATGIRVRDYPITLDKLLDKLPDVV |
|
Click the Chain column or image, you can go into the individual page to check the individual Chain modeling results.
|
|
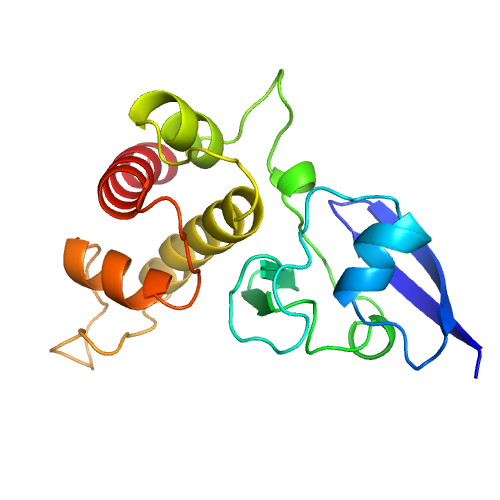
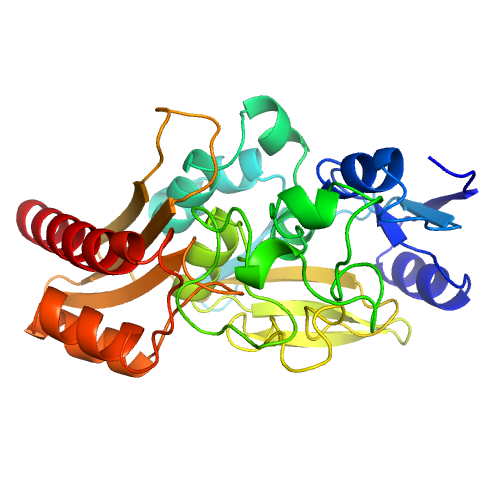
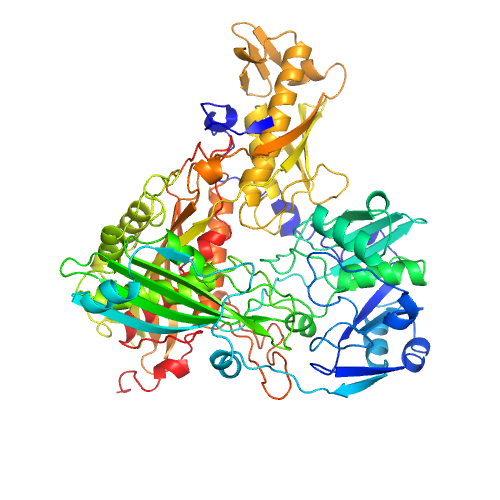
Top 5 Final Models From DMFold
|
|
|
Note: If the JSmol model is not visible, please refresh the page or click the radio buttons
|
|
| (a) | DMFold generates a large set of structural models by different MSAs as inputs. These models are ranked by predicted TM-score (pTM-score for multimer) or predicted LDDT (pLDDT for monomer) and top 5 models are selected with the highest predicted scores. |
|
|
Residue-level Modeling Quality
|
pLDDT of chain A
pLDDT of chain B
pLDDT of chain C
|
|
Proteins With Similar Structure
|
|
| |
|
Top 10 structural analogs in PDB (as identified by
US-align)
Note: If the JSmol model is not visible, please refresh the page or click the radio buttons
| (a) | Query structure is shown in cartoon, while the structural analog is displayed using backbone trace. |
| (b) | Ranking of proteins is based on TM-score of the structural alignment between the query structure and known structures in the PDB library. |
| (c) | RMSDa is the RMSD between residues that are structurally aligned by US-align. |
| (d) | IDENa is the percentage sequence identity in the structurally aligned region. |
| (e) | Cov. represents the coverage of the alignment by TM-align and is equal to the number of structurally aligned residues divided by length of the query protein. |
|
|
Predicted Gene Ontology (GO) Terms
|

|
| GO term | FreqGO | Chain ID | Name |
| GO:0016491 | 1.00 | A,B,C | oxidoreductase activity |
| GO:1901363 | 1.00 | A,B,C | heterocyclic compound binding |
| GO:0097159 | 1.00 | A,B,C | organic cyclic compound binding |
| GO:0016903 | 1.00 | A,B,C | oxidoreductase activity, acting on the aldehyde or oxo group of donors |
| GO:0050660 | 1.00 | A,B,C | flavin adenine dinucleotide binding |
| GO:0016726 | 0.67 | A,C | oxidoreductase activity, acting on CH or CH2 groups, NAD or NADP as acceptor |
| GO:0004854 | 0.67 | A,C | xanthine dehydrogenase activity |
| GO:0000166 | 0.33 | B | nucleotide binding |
| GO:0050662 | 0.33 | C | coenzyme binding |
| Click the graph to show a high resolution version. |
| (a) | CscoreGO is the confidence score of predicted GO terms. CscoreGO values range in between [0-1]; where a higher value indicates a better confidence in predicting the function using the template. |
| (b) | FreqGO is the frequency of predicted GO terms with a CscoreGO greater than 0.5 among all terms within each chain of a complex protein. The FreqGO values range between [0-1], where a higher value indicates a greater proportion of high-confidence predictions (CscoreGO > 0.5) in the function annotation of the protein chain. |
| (c) | Chain ID indicates the specific protein chain in the complex that contains the GO term with a CscoreGO greater than 0.5. This identifier helps in associating high-confidence GO terms with their respective chains. |
| (d) | The graph shows the predicted terms within the Gene Ontology hierachy for Molecular Function. |
| | [0.4,0.5) | [0.5,0.6) | [0.6,0.7) | [0.7,0.8) | [0.8,0.9) | [0.9,1.0] |
|
|

|
| GO term | FreqGO | Chain ID | Name |
| GO:0044710 | 1.00 | A,B,C | single-organism metabolic process |
| GO:0044237 | 1.00 | A,B,C | cellular metabolic process |
| GO:0044763 | 1.00 | A,B,C | single-organism cellular process |
| GO:1901564 | 1.00 | A,B,C | organonitrogen compound metabolic process |
| GO:0044281 | 1.00 | A,B,C | small molecule metabolic process |
| GO:0006139 | 1.00 | A,B,C | nucleobase-containing compound metabolic process |
| GO:0072521 | 1.00 | A,B,C | purine-containing compound metabolic process |
| GO:1901565 | 1.00 | A,B,C | organonitrogen compound catabolic process |
| GO:1901361 | 1.00 | A,B,C | organic cyclic compound catabolic process |
| GO:0044712 | 1.00 | A,B,C | single-organism catabolic process |
| GO:0009115 | 1.00 | A,B,C | xanthine catabolic process |
| GO:0055086 | 0.67 | A,B | nucleobase-containing small molecule metabolic process |
| GO:0046700 | 0.67 | A,B | heterocycle catabolic process |
| GO:0044270 | 0.67 | A,B | cellular nitrogen compound catabolic process |
| GO:0019439 | 0.67 | A,C | aromatic compound catabolic process |
| GO:0009112 | 0.67 | A,C | nucleobase metabolic process |
| GO:0006145 | 0.67 | A,B | purine nucleobase catabolic process |
| GO:0055114 | 0.67 | A,B | oxidation-reduction process |
| GO:0009987 | 0.33 | B | cellular process |
| GO:0008152 | 0.33 | B | metabolic process |
| GO:0044699 | 0.33 | B | single-organism process |
| GO:0071704 | 0.33 | B | organic substance metabolic process |
| GO:1901360 | 0.33 | B | organic cyclic compound metabolic process |
| GO:0046483 | 0.33 | B | heterocycle metabolic process |
| GO:0044238 | 0.33 | B | primary metabolic process |
| GO:0006807 | 0.33 | B | nitrogen compound metabolic process |
| GO:0044248 | 0.33 | B | cellular catabolic process |
| GO:0006144 | 0.33 | B | purine nucleobase metabolic process |
| GO:0072523 | 0.33 | B | purine-containing compound catabolic process |
| Click the graph to show a high resolution version. |
| (a) | CscoreGO is the confidence score of predicted GO terms. CscoreGO values range in between [0-1]; where a higher value indicates a better confidence in predicting the function using the template. |
| (b) | FreqGO is the frequency of predicted GO terms with a CscoreGO greater than 0.5 among all terms within each chain of a complex protein. The FreqGO values range between [0-1], where a higher value indicates a greater proportion of high-confidence predictions (CscoreGO > 0.5) in the function annotation of the protein chain. |
| (c) | Chain ID indicates the specific protein chain in the complex that contains the GO term with a CscoreGO greater than 0.5. This identifier helps in associating high-confidence GO terms with their respective chains. |
| (d) | The graph shows the predicted terms within the Gene Ontology hierachy for Biological Process. |
| | [0.4,0.5) | [0.5,0.6) | [0.6,0.7) | [0.7,0.8) | [0.8,0.9) | [0.9,1.0] |
|
|

|
| Click the graph to show a high resolution version. |
| (a) | CscoreGO is the confidence score of predicted GO terms. CscoreGO values range in between [0-1]; where a higher value indicates a better confidence in predicting the function using the template. |
| (b) | FreqGO is the frequency of predicted GO terms with a CscoreGO greater than 0.5 among all terms within each chain of a complex protein. The FreqGO values range between [0-1], where a higher value indicates a greater proportion of high-confidence predictions (CscoreGO > 0.5) in the function annotation of the protein chain. |
| (c) | Chain ID indicates the specific protein chain in the complex that contains the GO term with a CscoreGO greater than 0.5. This identifier helps in associating high-confidence GO terms with their respective chains. |
| (d) | The graph shows the predicted terms within the Gene Ontology hierachy for Cellular Component. |
| | [0.4,0.5) | [0.5,0.6) | [0.6,0.7) | [0.7,0.8) | [0.8,0.9) | [0.9,1.0] |
|
|
|
|
Predicted Enzyme Commission (EC) Numbers
|
Top 5 EC Number
| (a) | FreqEC is the frequency of predicted Enzyme Commission (EC) number among all terms within each chain of a complex protein, considering only those terms with a TM-score greater than 0.4 for PDB-hits. FreqEC values range in between [0-1]; |
| (b) | Chain ID indicates the specific protein chain in the complex that contains the Enzyme Commission (EC) number. |
|
|
Predicted Ligand Binding Sites
|
|
Template proteins with similar binding site:
Note: If the JSmol model is not visible, please refresh the page or click the radio buttons
| | Click on the PDB hit radio buttons to visualize all predicted binding ligands. |
| | Click on the Lig Name radio buttons to visualize selected binding ligand and residues. |
| (a) | TM-score is a measure of global structural similarity between query and template protein. |
| (b) | RMSDa the RMSD between residues that are structurally aligned by US-align. |
| (c) | IDENa is the percentage sequence identity in the structurally aligned region. |
| (d) | Cov. represents the coverage of global structural alignment and is equal to the number of structurally aligned residues divided by length of the query protein. |
| Download full result of the above ligand binding prediction. |
|
[Back to server]
|
Reference:
Qiqige Wuyun, Quancheng Liu, Yiying Guo, Lydia Freddolino, Wei Zheng.
DMFold: A deep learning platform for protein complex structure and function predictions based on DeepMSA2.
In preparation.
Wei Zheng, Qiqige Wuyun, Yang Li, Chengxin Zhang, P Lydia Freddolino, Yang Zhang.
Improving deep learning protein monomer and complex structure prediction using DeepMSA2 with huge metagenomics data.
Nature Methods, January 2024. https://doi.org/10.1038/s41592-023-02130-4.
Wei Zheng, Qiqige Wuyun, Peter L Freddolino, Yang Zhang.
Integrating deep learning, threading alignments, and a multi-MSA strategy for high-quality protein monomer and complex structure prediction in CASP15.
1-20. Proteins. (2023). doi:10.1002/prot.26585.
|
|